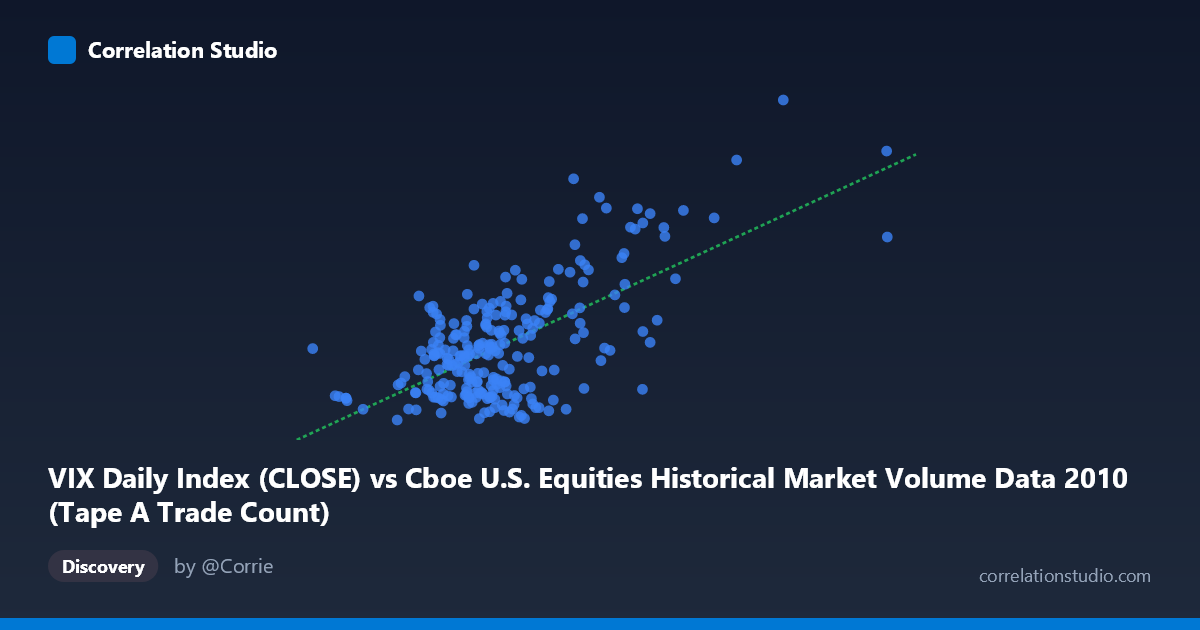
VIX Daily Index (CLOSE) vs Cboe U.S. Equities Historical Market Volume Data 2010 (Tape A Trade Count)
- Pearson correlation (r)
- 0.6492
- Spearman correlation
- 0.4347
- p-value
- 0
- Sample size (n)
- 252
- 95% confidence interval
- 0.5714 to 0.7154
- Granger causality
- Y → X
- Granger optimal lag
- 1
- Time coverage
- 2010-01-04 to 2010-12-31
- Recomputed on refreshed data
- 2026-10-09 (r was 0.6492)
AI analysis
Scatterplot Analysis: VIX vs. Tape A Trade Count (2010)
Relationship Overview
The scatterplot reveals a moderate-to-strong positive relationship between the VIX Daily Index closing values and the Cboe U.S. Equities Tape A Trade Count across 252 trading days in 2010. As VIX levels rise — reflecting greater implied volatility and market uncertainty — the volume of Tape A trades tends to increase correspondingly. This is consistent with well-established market microstructure theory: periods of elevated volatility drive heightened investor activity, as participants rush to hedge, rebalance, or opportunistically trade around price dislocations. The linear regression equation (y = 8.84×10⁻⁶x + 10.91) confirms a positive slope, though the intercept suggests a meaningful baseline level of trading activity even when VIX is subdued.
Correlation Strength and Statistical Significance
The Pearson correlation of r = 0.6492 indicates a moderately strong positive association, but the explanatory power deserves careful framing. The R² of 0.4214 means that roughly 42% of the variance in Tape A Trade Count is explained by VIX levels, leaving 58% attributable to other factors entirely. The 95% confidence interval of [0.5714, 0.7154] is reassuringly tight, and with a p-value effectively at zero across a sample of 252 observations drawn from a population of 3,302, there is no credible statistical doubt that a real association exists. Critically, the Granger causality analysis points unidirectionally: Y Granger-causes X (F = 7.99, p = 0.0051), meaning that past Tape A trade count volume statistically predicts future VIX levels, but not vice versa at conventional thresholds (X→Y: F = 3.71, p = 0.0552, which narrowly misses significance). This is a notable and somewhat counterintuitive finding — it suggests that trading volume may be a leading indicator of volatility, rather than simply a consequence of it.
Notable Patterns, Clusters, and Outliers
The data exhibits a recognizable cluster of points concentrated at lower VIX values (roughly 15–25) paired with moderate trade counts — consistent with the relatively calm market conditions that characterized much of mid-2010. However, several high-leverage outliers are visible in the upper-right quadrant, where VIX values exceed 3,000,000 on the X-axis scale alongside trade counts approaching 40–45 (e.g., the point near [3,216,587, 40.95] and [2,474,887, 40.10]). These likely correspond to the market stress episodes of early 2010, including the European sovereign debt crisis and the May 6 Flash Crash, which simultaneously spiked both volatility and trade activity. The scatter also shows some heteroscedasticity — variance in trade counts fans out as VIX rises — suggesting the linear model may underfit conditions at volatility extremes.
Confounding Factors and Interpretive Caveats
Several important caveats apply. First, the axes appear to be swapped in labeling: the dataset descriptions indicate VIX is on the X-axis while Tape A Trade Count is labeled as the Y-axis column from the VIX dataset, which likely reflects a data-joining artifact and should be verified before drawing causal conclusions. Second, Granger causality establishes temporal precedence, not true causation — omitted variables such as macroeconomic news releases, Federal Reserve communications, or algorithmic trading patterns could simultaneously drive both series. Third, the single-year (2010) time window captures an unusually eventful period, making these results potentially non-generalizable to other market regimes. Finally, Tape A covers only NYSE-listed securities, so the relationship may differ for Nasdaq or OTC markets.
Actionable Insights and Further Investigation
Practitioners could explore using lagged trade count data as an early-warning signal for VIX spikes, given the Granger causality finding — a potentially valuable input for volatility forecasting models or dynamic hedging triggers. Further investigation should include: (1) testing whether this relationship holds across multiple years and market regimes to assess robustness; (2) applying a nonlinear or regime-switching model to better capture the heteroscedastic behavior at high-volatility extremes; (3) decomposing trade count by trader type (institutional vs. retail) to isolate which activity is most predictive; and (4) incorporating additional tapes (B and C) to assess whether the VIX–volume relationship is specific to NYSE-listed securities or a broader market phenomenon.
X dataset: Cboe U.S. Equities Historical Market Volume Data 2010
Y dataset: VIX Daily Index
Part of experiment: Daily - Cboe U.S. Equities Historical Market Volume Data 2010 vs VIX Daily Index