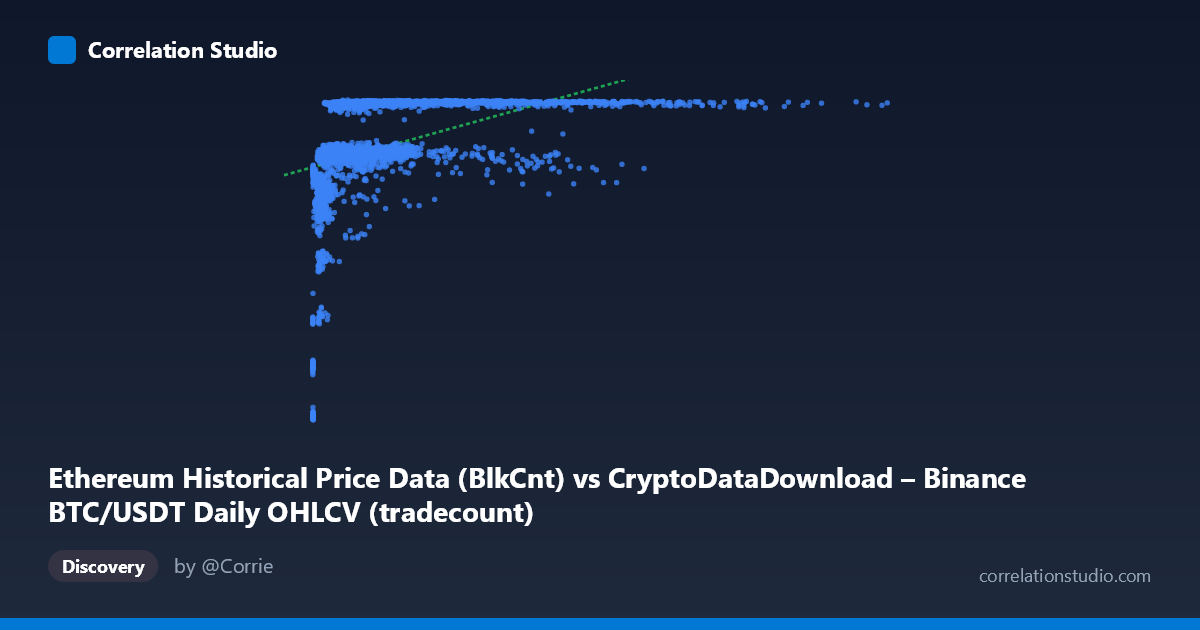
Ethereum Historical Price Data (BlkCnt) vs CryptoDataDownload – Binance BTC/USDT Daily OHLCV (tradecount)
- Pearson correlation (r)
- 0.4563
- Spearman correlation
- 0.7086
- p-value
- 0
- Sample size (n)
- 3191
- 95% confidence interval
- 0.4284 to 0.4834
- Granger causality
- None
- Granger optimal lag
- 1
AI analysis
Analysis: Ethereum Block Count vs. BTC/USDT Trade Count
1. Relationship Overview
The scatterplot reveals a moderate positive but distinctly non-linear relationship between the two variables. At low X values (roughly below 300,000), Y climbs steeply and erratically, moving from ~2,800 up to nearly 7,000. Once X exceeds approximately 500,000–1,000,000, Y plateaus in a tight band between roughly 6,300 and 7,200, regardless of how large X grows (even out to 15+ million). This produces a classic "logarithmic" or "saturating" curve shape rather than a straight line — the visual signature the Spearman/Pearson discrepancy is flagging.
2. Strength, Direction, and Statistical Confidence
The Pearson correlation (r = 0.456, R² = 0.208) indicates a moderate positive linear association, but only ~21% of the variance in Y is explained by a linear fit in X — leaving roughly 79% unexplained. The 95% CI [0.428, 0.483] is narrow, and the p-value is effectively zero, so we can be confident a non-zero linear relationship exists; the uncertainty is not about whether a relationship exists but about how well linear correlation captures it. Since the note indicates Spearman ρ Pearson r, the monotonic relationship is stronger than the linear one — reinforcing that a log or power-law transform of X would likely raise explained variance substantially. On causality: neither direction shows significant Granger causality at the 5% level, though X→Y is borderline (p=0.07), hinting at a weak, inconclusive lead-lag signal from block count to trade count, but not strong enough to claim predictive power in either direction.
3. Patterns, Clusters, and Outliers
Three regions stand out: - Low-X cluster (X < 300K): highly volatile Y values (2,800–6,000), suggesting this region corresponds to early history (2017–2018) when both network activity and exchange trade counts were immature and noisy. - Mid-X transition (300K–1M): rapid rise and stabilization of Y toward the 7,000 ceiling. - High-X plateau (X 1M, up to 15M): Y is essentially flat, clustering tightly near 7,100–7,180 with very low variance, indicating a saturation/ceiling effect — trade count appears bounded near an upper limit independent of block count growth.
The extreme X range (spanning ~4 orders of magnitude, mean 1.97M vs. stdev 2.24M) confirms heavy right-skew, meaning a few very large X values (8M–15M) exert disproportionate leverage on any linear fit.
4. Confounding Factors and Caveats
Both series are time-indexed cryptocurrency metrics (2017–2026), meaning they likely share common trends driven by overall market maturation, adoption growth, and exchange volume expansion — not a direct mechanical relationship between ETH block count and BTC/USDT trade count. This is a classic case of spurious correlation via shared temporal trend/growth trajectory: both variables generally increased over the dataset's timeframe as crypto markets matured, inflating the correlation without implying causation. Additionally, the extreme skew in X (block count) means the linear r is sensitive to outliers/high-leverage points at the tail. The saturation pattern also suggests a structural ceiling (e.g., max realistic daily trade count on the exchange) rather than a true asymptotic relationship with ETH network activity.
5. Suggested Next Steps
- Re-fit with log(X) or a saturating/logistic model — likely to substantially improve R² given the plateau shape and Spearman/Pearson gap. - Detrend both series (e.g., first-difference or remove long-term trend) before assessing correlation, to test whether the association survives after removing shared time-trend — this is critical given both are crypto metrics from overlapping eras. - Segment analysis: analyze the low-X (2017–2018) and high-X (mature market) regimes separately, since pooling them together likely distorts a single linear coefficient. - Revisit Granger test with detrended/log-transformed series and multiple lags, since the borderline X→Y result (p=0.07) may sharpen or disappear once nonlinearity and trend are addressed. - Treat the current linear correlation as a weak, partially trend-driven signal — not a basis for causal or predictive claims linking ETH network usage to BTC exchange trading activity.
X dataset: CryptoDataDownload – Binance BTC/USDT Daily OHLCV
Y dataset: Ethereum Historical Price Data
Part of experiment: Bitcoin - CryptoDataDownload – Binance BTC/USDT Daily OHLCV vs Ethereum Historical Price Data