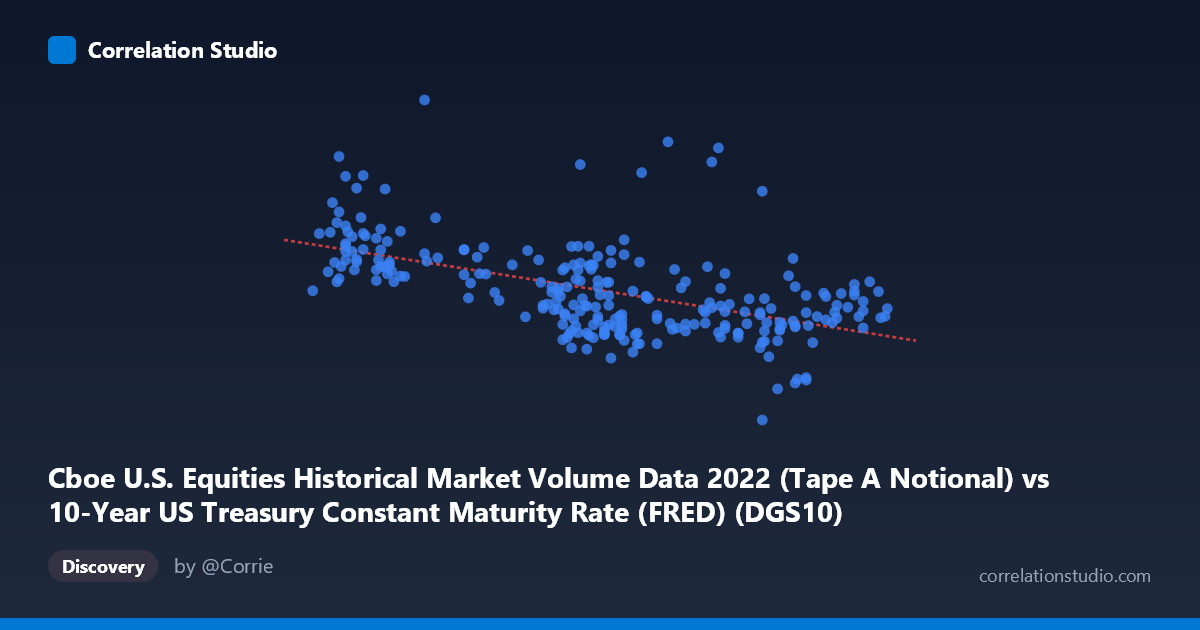
Cboe U.S. Equities Historical Market Volume Data 2022 (Tape A Notional) vs 10-Year US Treasury Constant Maturity Rate (FRED) (DGS10)
- Pearson correlation (r)
- -0.543
- Spearman correlation
- -0.5712
- p-value
- 0
- Sample size (n)
- 249
- 95% confidence interval
- -0.6252 to -0.449
- Granger causality
- None
- Granger optimal lag
- 10
AI analysis
Analysis: 10-Year Treasury Yield vs. Cboe Equity Market Notional Volume (2022)
Relationship Overview The scatterplot reveals a moderate negative relationship between the 10-year US Treasury constant maturity rate (X-axis) and Cboe U.S. equity market notional trading volume (Y-axis) across 249 trading days in 2022. The linear regression equation (y = -1.815×10⁹x + 1.555×10¹⁰) indicates that for each one-percentage-point increase in the 10-year yield, notional equity volume declines by approximately $1.81 billion on average. This directional finding is economically intuitive: as interest rates rise, higher discount rates compress equity valuations, risk appetite diminishes, and equity market participation may contract — all of which could suppress notional trading volumes.
Correlation Strength and Statistical Significance The correlation coefficient of r = -0.543 reflects a moderate negative association, but the explanatory power deserves careful framing. The R² of 0.295 means that rising Treasury yields explain only about 29.5% of the variance in equity notional volume — leaving roughly 70.5% attributable to other factors. The 95% confidence interval of [-0.625, -0.449] is meaningfully bounded away from zero on both ends, suggesting the negative direction is robust. The p-value of effectively zero, combined with a population size of N = 4,769, confirms this is not a chance finding at any conventional significance threshold. However, the Granger causality results tell a notably different story: neither direction (X→Y nor Y→X) achieves significance at optimal lag 10 (F = 1.046, p = 0.406 and F = 0.672, p = 0.750, respectively). This means that while yields and volume are contemporaneously correlated, neither variable reliably predicts the other's future values in a temporal sense — an important caveat against causal interpretation.
Notable Patterns, Clusters, and Outliers Several structural features stand out in the data. There is a visible cluster of high-volume observations concentrated at lower yield values (roughly 1.63–2.50%), consistent with early-2022 conditions before the Federal Reserve's aggressive rate-hiking cycle fully materialized. As yields move toward the 3.0–4.25% range, notional volumes tend to compress and cluster more tightly at lower levels, though with considerable spread. Notable outliers include a few observations near yields of 1.65–1.85% with volumes exceeding $15–16 billion, well above the regression line, and conversely, some high-yield observations (~3.8–4.1%) with volumes remaining near $9–10 billion that resist the downward trend. The data also shows heteroscedasticity: variance in Y appears substantially wider at low X values than at high X values, suggesting the relationship is not uniform across the yield spectrum and that a simple linear model may underfit the lower-yield regime.
Confounding Factors and Interpretive Caveats The 2022 period is a highly specific macroeconomic environment — characterized by historically rapid Fed rate hikes, post-pandemic volatility normalization, and geopolitical shocks (Ukraine conflict) — which may make this correlation non-generalizable to other periods. Several confounders likely operate simultaneously: market volatility (VIX), inflation prints, earnings seasons, and index rebalancing events all independently drive notional volume, and each correlates partially with yield levels. The dataset label mismatch (Treasury yield data labeled under Cboe columns and vice versa) warrants verification that axes are correctly assigned before drawing firm conclusions. Additionally, notional volume is sensitive to price levels — in a declining equity market (which accompanied rising rates in 2022), lower prices mechanically reduce notional values even if share volumes remain stable, potentially amplifying the observed negative correlation beyond what true activity levels would show.
Actionable Insights and Further Investigation Practitioners should avoid treating this correlation as a causal trading signal, given the failed Granger causality tests — yield changes do not appear to lead volume in a temporally exploitable way. More productive next steps would include: (1) decomposing notional volume into share volume vs. price effects to isolate mechanical valuation impacts from genuine activity changes; (2) adding VIX and Fed meeting dates as covariates to test whether the yield-volume correlation survives multivariate controls; (3) testing a non-linear or piecewise model given the visible heteroscedasticity, particularly examining whether a threshold around 3.0% yield marks a structural break; and (4) extending the analysis to multiple years (e.g., 2018–2023) to determine whether 2022's rate environment produces an unusually strong correlation or reflects a durable structural relationship between credit market conditions and equity market activity.
X dataset: 10-Year US Treasury Constant Maturity Rate (FRED)
Y dataset: Cboe U.S. Equities Historical Market Volume Data 2022
Part of experiment: Daily - 10-Year US Treasury Constant Maturity Rate (FRED) vs Cboe U.S. Equities Historical Market Volume Data 2022