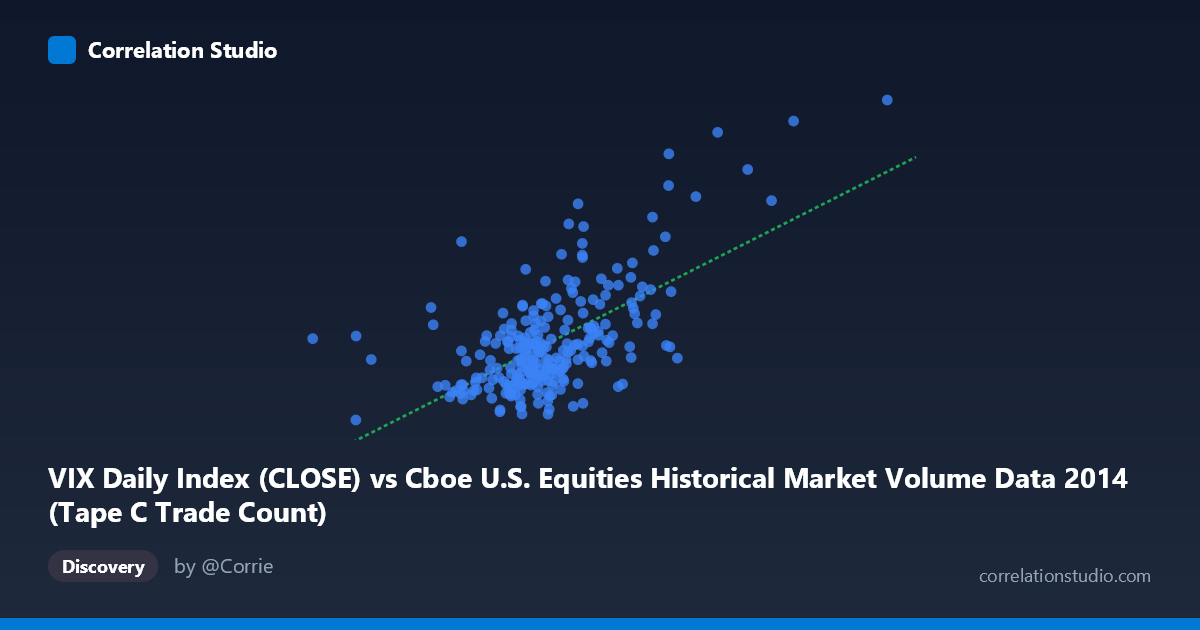
VIX Daily Index (CLOSE) vs Cboe U.S. Equities Historical Market Volume Data 2014 (Tape C Trade Count)
- Pearson correlation (r)
- 0.6274
- Spearman correlation
- 0.5174
- p-value
- 0
- Sample size (n)
- 252
- 95% confidence interval
- 0.5462 to 0.6969
- Granger causality
- None
- Granger optimal lag
- 1
AI analysis
Scatterplot Analysis: VIX vs. Tape C Trade Count (2014)
Relationship Overview The scatterplot reveals a moderate positive relationship between the Cboe VIX Daily Index (Close) and the Tape C Trade Count across U.S. equities exchanges in 2014. As the VIX rises — reflecting heightened investor fear and market uncertainty — the volume of Tape C trades tends to increase correspondingly. This aligns intuitively with established market behavior: periods of volatility typically drive elevated trading activity as investors rebalance, hedge, or react to rapidly shifting prices. The linear regression equation (y = 1.5686E-05x + 3.987) suggests that for every unit increase in VIX, trade count increases modestly but consistently.
Correlation Strength and Statistical Significance The correlation of r = 0.627 indicates a moderate-to-strong positive association, though the r² = 0.394 figure is the more sobering metric — VIX explains only about 39.4% of the variance in Tape C trade counts, leaving the majority of variability attributable to other factors. The 95% confidence interval [0.546, 0.697] is meaningfully above zero and relatively tight given the sample size (n = 252), and the p-value ≈ 0 confirms this is not a chance finding across the N = 3,686 population. However, the Granger causality results are non-significant in both directions (X→Y: F = 2.91, p = 0.089; Y→X: F = 0.10, p = 0.748), meaning neither variable reliably predicts the other at a one-period lag. This is a critical caveat: the correlation is real, but there is no evidence of temporal predictive directionality — VIX movements do not statistically lead trade counts, nor vice versa, at this resolution.
Notable Patterns, Clusters, and Outliers The sample points reveal a fairly dense core cluster concentrated in the VIX range of roughly 550,000–750,000 (X-axis) and 11–16 (Y-axis), suggesting that most trading days in 2014 were characterized by relatively stable, moderate conditions. However, several pronounced high-leverage outliers stand out distinctly — most notably points near (1,041,591, 25.20) and (841,278, 23.57), which correspond to episodes of elevated VIX and substantially higher trade activity. These outliers appear to exert considerable influence on the regression slope and the overall r value, and their removal would likely weaken the measured correlation materially. The distribution also appears mildly heteroscedastic, with variance in trade counts increasing at higher VIX levels — consistent with the unpredictable and reactive nature of high-volatility market episodes.
Confounding Factors and Interpretive Caveats Several important confounds merit caution. First, calendar effects — such as end-of-quarter rebalancing, options expiration dates, or holiday-thinned trading — can simultaneously spike both VIX and trade volume without a direct causal mechanism linking the two. Second, market structure events in 2014 (e.g., flash crashes, Federal Reserve announcements, geopolitical shocks) could create correlated spikes that inflate the r value artificially. Third, Tape C specifically covers NYSE Arca-listed securities, meaning this relationship may not generalize to Tape A or B venues. Finally, the Granger non-significance at lag-1 raises the possibility that any predictive relationship, if it exists, operates at a different temporal resolution (intraday or multi-day) not captured in this daily aggregation.
Actionable Insights and Further Investigation Practitioners could explore whether a non-linear model (e.g., logarithmic or piecewise regression) better captures the accelerating trade activity at extreme VIX levels suggested by the outlier cluster. It would be worthwhile to test Granger causality at lags beyond 1 period (e.g., 2–5 days) to assess whether VIX anticipates trade volume shifts over a slightly longer horizon. Comparing this relationship across Tape A and Tape B data would clarify whether this is a market-wide phenomenon or Arca-specific. Additionally, controlling for contemporaneous macro variables — such as S&P 500 daily returns, Federal Reserve meeting dates, or earnings season windows — would help isolate the true VIX-to-volume signal and improve the predictive utility of the model beyond its current 39.4% explanatory power.
X dataset: Cboe U.S. Equities Historical Market Volume Data 2014
Y dataset: VIX Daily Index
Part of experiment: Daily - Cboe U.S. Equities Historical Market Volume Data 2014 vs VIX Daily Index