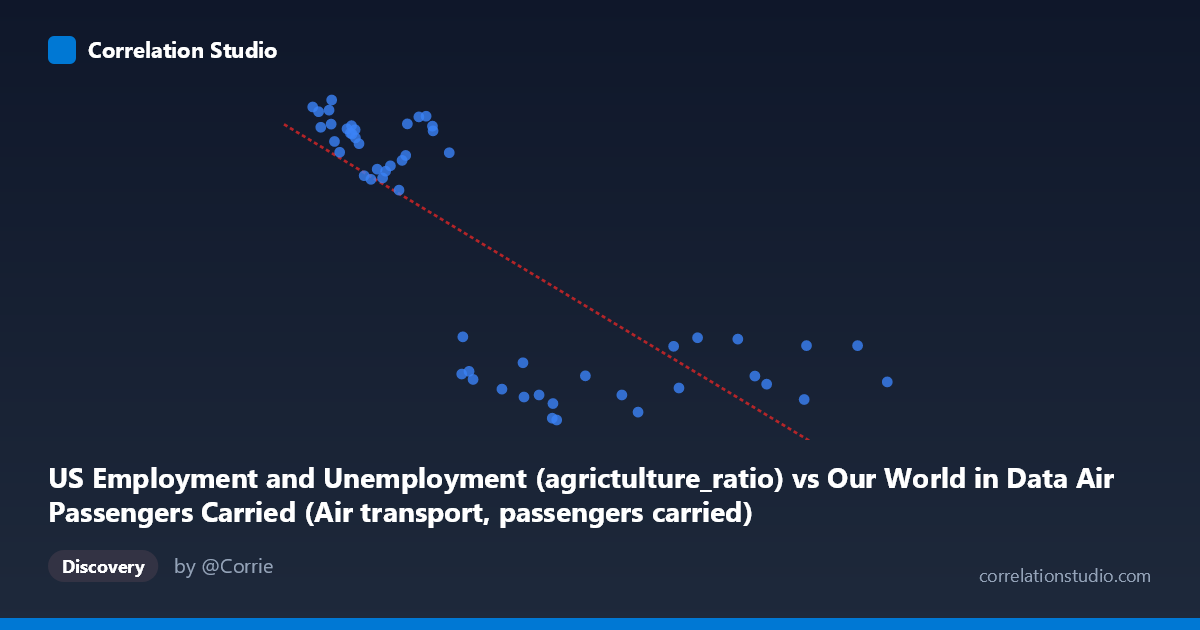
US Employment and Unemployment (agrictulture_ratio) vs Our World in Data Air Passengers Carried (Air transport, passengers carried)
- Pearson correlation (r)
- -0.7891
- Spearman correlation
- -0.7999
- p-value
- 0
- Sample size (n)
- 54
- 95% confidence interval
- -0.8725 to -0.661
- Granger causality
- None
- Granger optimal lag
- 10
AI analysis
Scatterplot Analysis: US Agriculture Employment Ratio vs. Air Passengers Carried
Relationship Overview
The scatterplot reveals a clear negative relationship between the US agriculture employment ratio and global air transport passengers carried. As the agriculture employment ratio increases (suggesting a higher proportion of the workforce in agriculture, characteristic of earlier decades), air passenger volumes tend to be substantially lower. Conversely, as the agriculture ratio declines over time — reflecting structural economic modernization — air travel volumes rise dramatically. The linear regression equation (y = -1.217×10⁻⁵x + 3428.73) captures this downward slope well, and visually the data points follow a reasonably coherent diagonal band from upper-left to lower-right across the chart.
Correlation Strength and Statistical Interpretation
The Pearson correlation of r = -0.789 indicates a strong negative association, and the R² of 0.623 means that approximately 62.3% of the variance in air passenger volumes is statistically explained by variation in the agriculture employment ratio. This is a meaningful explanatory share, though nearly 38% of variance remains attributable to other factors. The 95% confidence interval of [-0.873, -0.661] is relatively tight and does not cross zero, reinforcing confidence in the direction and magnitude of the relationship. The p-value of 1.363×10⁻¹² is extraordinarily small, making it virtually certain this correlation is not a chance artifact in the sample. However, the Granger causality results tell a more cautionary story: neither direction (X→Y nor Y→X) achieves significance (F = 0.24, p = 0.99 and F = 0.65, p = 0.75 respectively), meaning that neither variable temporally predicts the other beyond what each already predicts about itself. This strongly suggests the correlation reflects a shared temporal trend rather than any direct causal mechanism.
Notable Patterns, Clusters, and Outliers
The data cluster into two loosely distinguishable groups: one in the upper-left (higher agriculture ratio ~80M–130M range on X, corresponding to Y values of roughly 2,095–2,460 passengers), representing more recent or economically developed periods with lower agricultural labor shares and higher travel, and another in the lower-right where earlier decades show elevated agriculture ratios and depressed air travel. A few points stand out — the observation at (61.7M, 2,095) sits notably low on Y for its X position, and (12.3M, 3,515) anchors the upper extreme of passengers carried. Some scatter around X values of 25M–45M suggests a transitional zone where the relationship is noisier, possibly reflecting economic disruptions or structural shifts in both labor markets and aviation capacity.
Confounding Factors and Caveats
This correlation is almost certainly a classic case of shared temporal trend (spurious correlation via common time driver). Both variables are strongly time-dependent: agriculture's share of US employment has declined steadily since the mid-20th century, while global air travel has grown exponentially over the same period. The fact that Granger causality is entirely absent confirms there is no predictive temporal signal between the two series — they move together only because both are driven by the passage of time and broader socioeconomic modernization. Additionally, the X-axis variable is drawn from an air passengers dataset (noted as "agricultureratio"), which warrants scrutiny about how this ratio was constructed and whether it represents US-specific data being cross-correlated with global passenger figures — a potential unit mismatch or geographic inconsistency. Sample size (n=54 of N=86) and annual aggregation may also mask within-period volatility.
Actionable Insights and Further Investigation
Given the absence of Granger causality, no policy or operational recommendation should treat agricultural employment as a predictor of air travel demand. The correlation is best interpreted as a temporal proxy relationship — both variables are markers of the same underlying modernization process. Further investigation should: (1) detrend both series (e.g., first-differencing or HP filtering) and re-examine whether any residual correlation survives; (2) introduce explicit time as a covariate to test whether r collapses toward zero; (3) explore theoretically motivated predictors of air travel such as GDP per capita, fuel prices, or urbanization rates; and (4) clarify the construction of the "agricultureratio" column to ensure it is conceptually coherent and geographically matched to the passenger data. Any forecasting model built on this correlation alone would be misleading.
X dataset: Our World in Data Air Passengers Carried
Y dataset: US Employment and Unemployment
Part of experiment: Yearly - Our World in Data Air Passengers Carried vs US Employment and Unemployment