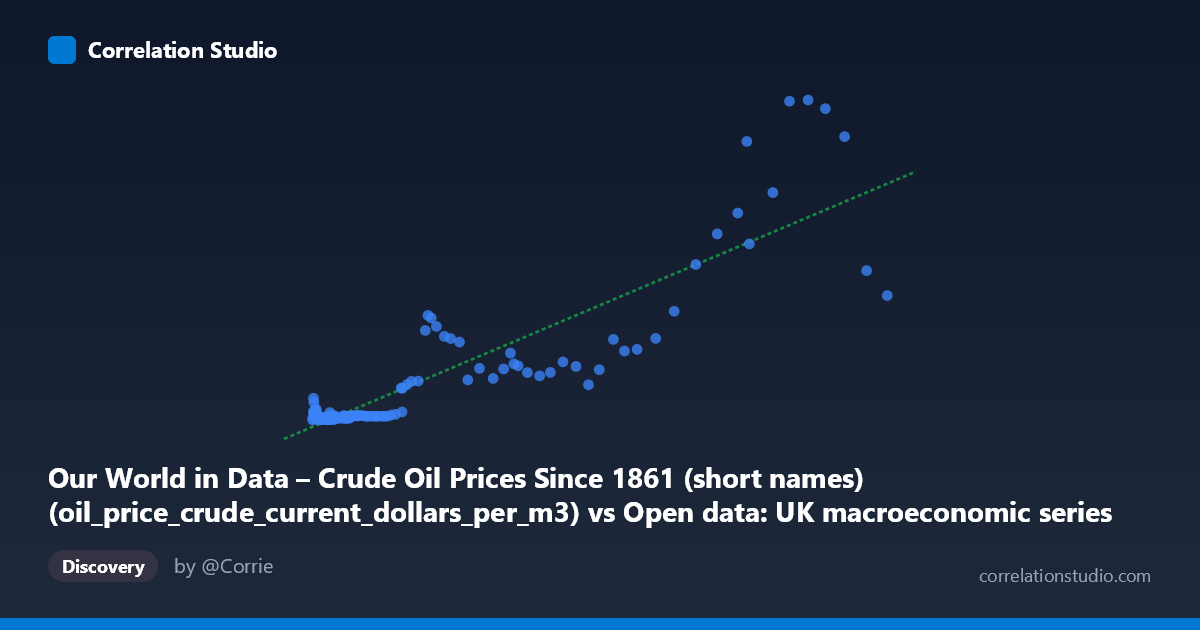
Our World in Data – Crude Oil Prices Since 1861 (short names) (oil_price_crude_current_dollars_per_m3) vs Open data: UK macroeconomic series from 1086 to present. Bank of England Millennium of Macroeconomic Data. (Year) (value)
- Pearson correlation (r)
- 0.891
- Spearman correlation
- 0.6878
- p-value
- 0
- Sample size (n)
- 156
- 95% confidence interval
- 0.8533 to 0.9194
- Granger causality
- None
- Granger optimal lag
- 10
- Time coverage
- 1861-01-01 to 2016-01-01
- Recomputed on refreshed data
- 2026-10-09 (r was 0.891)
AI analysis
Analysis: Crude Oil Prices vs. UK Macroeconomic Series (1861–2016)
1. Overall Relationship
The scatterplot reveals a strong positive relationship between crude oil prices (in current dollars per cubic meter) and the UK macroeconomic variable on the Y-axis — most likely a nominal price index, wage level, or money supply figure given the Bank of England dataset's composition. Both variables rise together across the 155-year time span, tracing what is effectively a shared inflationary and economic growth trajectory. The linear regression equation (y = 0.00115523x − 22.07) captures the central tendency, but the visual pattern almost certainly shows a curved, exponential-like sweep rather than a clean straight line, reflecting the compound nominal growth of both series over time.
2. Correlation Strength and Statistical Interpretation
The Pearson correlation of r = 0.891 is very strong by conventional standards, and the coefficient of determination r² = 0.794 means that roughly 79.4% of the variance in the UK macroeconomic variable is statistically explained by crude oil prices within this sample. The 95% confidence interval of [0.853, 0.919] is narrow and sits entirely in high-correlation territory, indicating this result is robust across plausible sampling variation. The p-value of effectively zero confirms the association is not a chance artifact at any conventional significance threshold. However, the Granger causality tests tell a critically different story: neither direction (X→Y: F = 0.611, p = 0.802; Y→X: F = 1.033, p = 0.420) approaches significance, even at an optimal lag of 10 periods. This means that, despite the high contemporaneous correlation, knowing past oil prices does not improve forecasts of the UK series beyond its own history, and vice versa. The two series move together without one reliably leading the other in time.
3. Notable Patterns, Clusters, and Outliers
The sample points reveal several distinct structural features. A dense cluster of low-value observations sits in the lower-left corner — points with oil prices below ~50,000 and Y-values below ~25 — spanning much of the pre-1970s era when both nominal oil prices and UK macro indicators were comparatively subdued. Above roughly x = 100,000, the data fans out considerably, with high leverage points such as (468,775, 275), (315,607, 343), and (298,265, 241) pulling the regression line strongly and contributing disproportionately to the r² value. A few points appear anomalous relative to the main trend — notably (103,847, 226) and (10,084, 24) and (12,582, 15), which sit well above the regression line for their X values, suggesting periods where the UK macro variable spiked independently of oil prices. The overall shape of the cloud likely follows a power-law or log-log relationship more faithfully than the imposed linear model, meaning the linear r² of 0.794, while high, may be partly an artifact of shared long-run nominal growth trends.
4. Confounding Factors and Caveats
The most significant caveat here is the spurious correlation problem endemic to long nominal time series: both crude oil prices and virtually any UK nominal macroeconomic indicator (wages, price levels, money supply, nominal GDP) will share a common upward drift driven by global inflation, currency debasement, and economic growth over 155 years. This shared trend can mechanically inflate correlation well above what any causal mechanism would produce. The absence of Granger causality is consistent with this interpretation — the correlation is real mathematically but may reflect a common third driver (long-run inflation or global monetisation) rather than any direct link between oil markets and UK macroeconomic outcomes. Additionally, the axes are in nominal terms, so no real purchasing-power adjustment has been made. Structural breaks — the 1973 OPEC shock, the 1979 crisis, the 2008 financial crisis, post-2014 oil price collapse — likely create distinct sub-regime clusters that the single linear model obscures. The dataset mismatch (X drawn from one dataset, Y from another) also introduces potential alignment and definitional inconsistencies.
5. Actionable Insights and Further Investigation
Several analytical steps would substantially strengthen or reframe these findings. First, log-transforming both variables would linearise the likely power-law relationship, reduce heteroscedasticity, and produce an elasticity interpretation directly comparable across eras. Second, deflating both series to real (inflation-adjusted) terms would strip out the shared nominal growth trend and test whether any genuine economic link persists — the correlation would likely fall substantially. Third, sub-period analysis (e.g., pre-1945, 1945–1980, 1980–2016) could reveal whether the relationship is structurally stable or driven by one particular era. Fourth, introducing explicit third variables — UK CPI, global GDP, or US dollar exchange rates — as controls in a multivariate regression would help isolate whether oil prices carry independent explanatory power. Finally, re-running Granger causality on log-differenced (stationary) series with a broader lag search would provide a more reliable test of temporal predictive direction than the levels-based test reported here, which may have been confounded by the shared non-stationary trend.
X dataset: Open data: UK macroeconomic series from 1086 to present. Bank of England Millennium of Macroeconomic Data. (Year)
Y dataset: Our World in Data – Crude Oil Prices Since 1861 (short names)
Part of experiment: Yearly - Open data: UK macroeconomic series from 1086 to present. Bank of England Millennium of Macroeconomic Data. (Year) vs Our World in Data – Crude Oil Prices Since 1861 (short names)