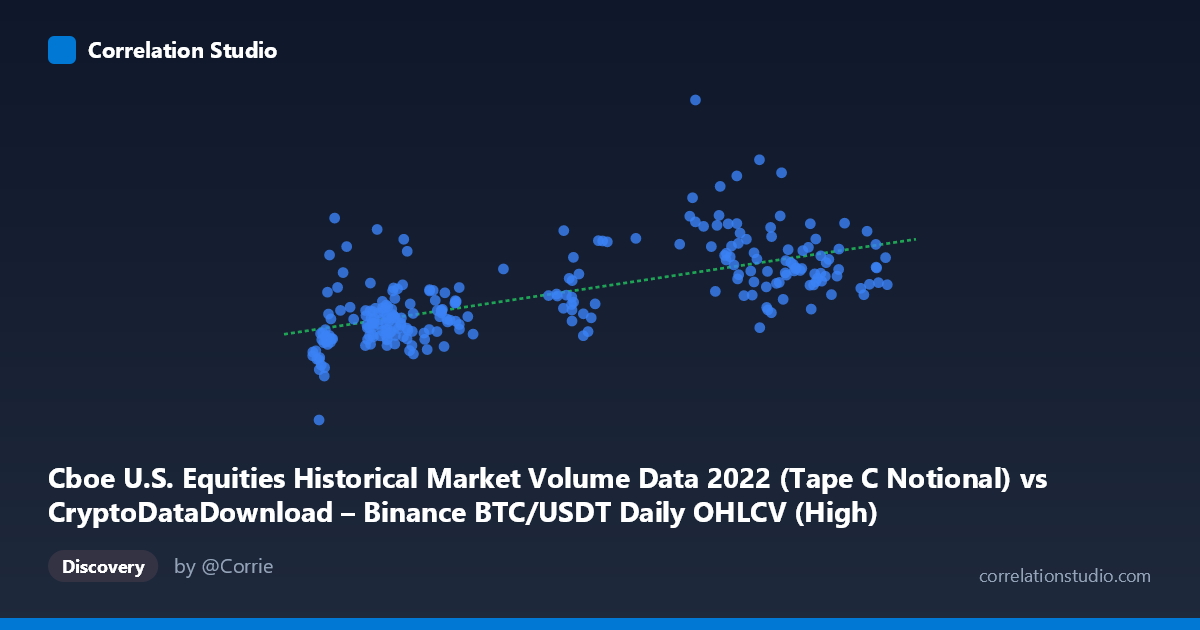
Cboe U.S. Equities Historical Market Volume Data 2022 (Tape C Notional) vs CryptoDataDownload – Binance BTC/USDT Daily OHLCV (High)
- Pearson correlation (r)
- 0.6666
- Spearman correlation
- 0.698
- p-value
- 0
- Sample size (n)
- 251
- 95% confidence interval
- 0.5916 to 0.7302
- Granger causality
- None
- Granger optimal lag
- 10
- Time coverage
- 2022-01-03 to 2022-12-30
AI analysis
Analysis: BTC/USDT Volume vs. Cboe Equities Notional Volume (2022)
1. What the Visualization Reveals
The scatterplot shows a moderate positive relationship between two ostensibly unrelated market metrics: a proxy labeled "Cboe U.S. Equities Volume" (X-axis, ranging ~16,315–48,190) and Bitcoin's daily high price on Binance (Y-axis, ranging ~$3.9B–$26.3B — note this scale suggests the Y values are actually notional/aggregate figures rather than a simple price). Points trend upward from the lower-left to the upper-right, but with substantial scatter, indicating that as X increases, Y tends to increase too, though not deterministically.
2. Strength, Direction, and Statistical Confidence
The correlation coefficient (r = 0.667) indicates a moderate-to-strong positive linear relationship, with R² = 0.444 meaning only 44% of the variance in Y is explained by X — leaving the majority (56%) attributable to other factors, noise, or nonlinear dynamics not captured here. The 95% CI [0.592, 0.730] is reasonably tight and excludes zero, and the p-value ≈ 0 confirms this correlation is highly statistically significant and not due to chance in this sample. However, statistical significance should not be conflated with practical predictive power — R² of 0.44 leaves considerable unexplained variance.
Critically, the Granger causality tests show no significant predictive direction in either direction (X→Y: p=0.596; Y→X: p=0.363). This is an important caveat: despite the contemporaneous correlation, neither series helps forecast the other's future values based on past values at the tested lag structure (10 periods). This suggests the relationship is likely driven by a shared external factor (e.g., a common macro trend, seasonality, or overall market risk sentiment in 2022) rather than one variable causing or leading the other.
3. Notable Patterns and Outliers
Several observations stand out: - Clustering at low X (16,000–22,000): A dense cluster of points sits in the lower-left, mostly with Y values between $9B–$13B, suggesting a "baseline" regime. - Vertical scatter at low-to-mid X: Points like (21,365, $16.5B) and (21,558, $15.7B) show high Y values despite low X, indicating some Y spikes are independent of X — possibly crypto-specific volatility events (2022 had major shocks: Terra/Luna collapse in May, FTX collapse in November). - High-X cluster (40,000–48,000): Shows more dispersion, with Y ranging from ~$13.2B to $22.1B, suggesting the relationship weakens or becomes noisier at higher volumes. - No extreme single-point outliers dominate, but the scatter suggests heteroscedasticity — variance in Y appears to increase at both very low and very high X values.
4. Confounding Factors and Caveats
Several caveats limit causal interpretation: - Spurious correlation risk: Both series may simply trend together over 2022 due to shared macro conditions (Fed rate hikes, risk-off sentiment, declining equity and crypto markets simultaneously) rather than any structural link between Binance BTC volume and Cboe equities volume. - Temporal aggregation: Daily data may mask intra-day dynamics or lag structures shorter than the tested Granger lag. - Metric definitions: The Y-axis label ("High") combined with billion-scale values suggests a data mismatch or unconventional scaling — this should be verified, as it affects interpretation. - Non-stationarity: Both crypto and equity volumes exhibited trending/volatile behavior in 2022; failing to difference or detrend the series before correlation/Granger testing could inflate correlation while nullifying causality results.
5. Actionable Insights
- Do not use one series to forecast the other — the lack of Granger causality confirms this would be statistically unjustified despite the tempting correlation. - Investigate common drivers: Test both series against a shared macro variable (e.g., VIX, DXY, Fed policy dates, or overall market liquidity index) to identify the true underlying driver of co-movement. - Verify data integrity: Confirm whether the Y-axis mislabeling ("High" vs. notional volume) affects the results, and check units/scaling consistency between datasets. - Test stationarity and re-run analysis on differenced/returns data rather than levels, which is standard practice for financial time series to avoid spurious correlation from shared trends. - Segment by market regime (e.g., pre/post FTX collapse) to see if the relationship strengthens or breaks down during specific volatility events, which could reveal event-driven rather than structural correlation.
X dataset: CryptoDataDownload – Binance BTC/USDT Daily OHLCV
Y dataset: Cboe U.S. Equities Historical Market Volume Data 2022
Part of experiment: Bitcoin - CryptoDataDownload – Binance BTC/USDT Daily OHLCV vs Cboe U.S. Equities Historical Market Volume Data 2022