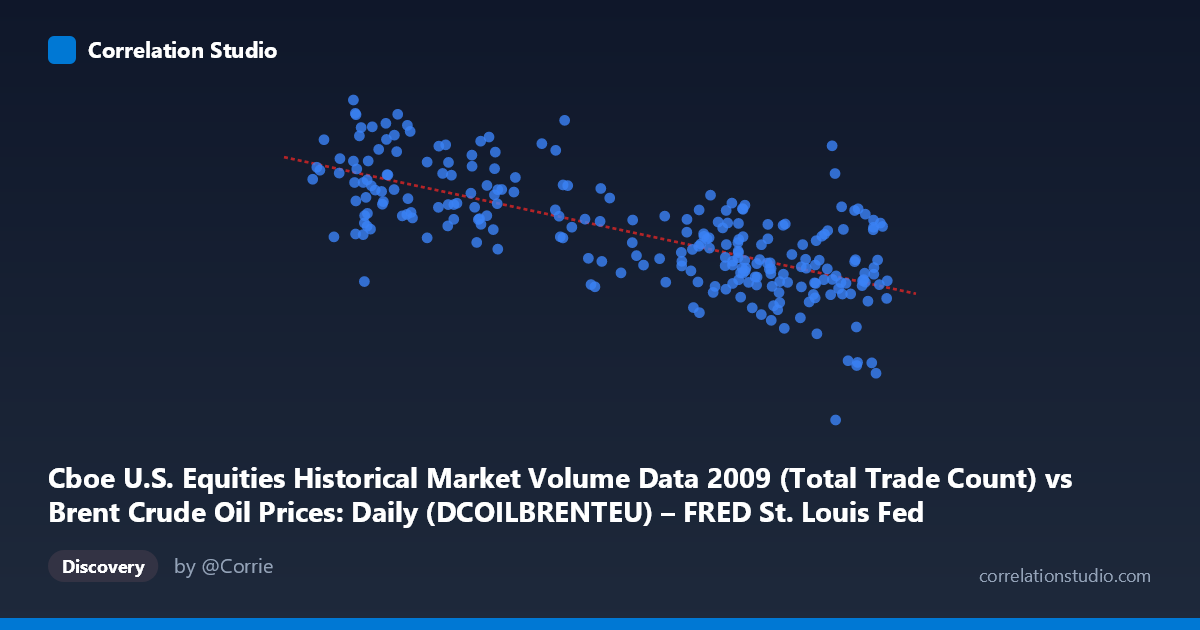
Cboe U.S. Equities Historical Market Volume Data 2009 (Total Trade Count) vs Brent Crude Oil Prices: Daily (DCOILBRENTEU) – FRED St. Louis Fed (DCOILBRENTEU)
- Pearson correlation (r)
- -0.7138
- Spearman correlation
- -0.6969
- p-value
- 0
- Sample size (n)
- 252
- 95% confidence interval
- -0.7695 to -0.6473
- Granger causality
- None
- Granger optimal lag
- 10
AI analysis
Analysis: Cboe U.S. Equities Trade Count vs. Brent Crude Oil Prices (2009)
Relationship Overview
The scatterplot reveals a moderate-to-strong negative relationship between Cboe U.S. equities total trade count and Brent crude oil prices across 252 trading days in 2009. As daily trade counts increase, Brent crude prices tend to decline, and vice versa. The linear regression equation (y = -34,632.8x + 4,805,210) quantifies this inverse slope: for every one-unit increase in the trade count index, crude oil prices fall by approximately $34,633 per barrel in predicted terms. Visually, the data points form a downward-sloping cloud, consistent with the negative correlation, though with considerable scatter around the regression line — suggesting the relationship is real but far from deterministic.
Correlation Strength and Statistical Significance
The Pearson correlation of r = -0.7138 indicates a moderately strong negative association. More meaningfully, r² = 0.5094, meaning that approximately 50.9% of the variance in Brent crude oil prices is statistically explained by variation in U.S. equity trade counts. While this is a substantial share, it equally implies that nearly half the variance remains unexplained by this single variable alone. The 95% confidence interval for r spans [-0.7695, -0.6473], which is reasonably tight and situated entirely in negative territory, reinforcing confidence in the direction of the relationship. With a p-value effectively equal to zero across a population of N = 3,232, the result is highly statistically significant and unlikely to be a chance artifact. However, Granger causality tests are notably non-significant in both directions — X→Y: F = 1.57, p = 0.116; Y→X: F = 1.23, p = 0.270 — meaning that neither variable reliably predicts future values of the other in a temporal sense. This is a critical caveat: the correlation captures a contemporaneous co-movement pattern, not a predictive or causal mechanism.
Notable Patterns, Clusters, and Outliers
Several structural features are visible in the data. There is a broad central cluster roughly centered around trade counts of 60–70 and prices of $2.0M–$3.0M, consistent with the dataset means. At lower trade counts (roughly 40–55), prices tend to be higher and more dispersed, spanning from approximately $2.7M to over $4.1M — suggesting that periods of lighter equity trading activity coincided with elevated crude prices, possibly reflecting broader risk sentiment or macroeconomic conditions during 2009's recovery phase. At higher trade counts (70+), prices cluster more tightly at lower values, though with some notable exceptions. Several outliers deserve attention: the point at approximately (75.15, 629,671) stands dramatically apart from the trend — an extremely low crude price paired with high trade activity — and may represent a data anomaly, a mis-match in date alignment, or a genuine market disruption. Similarly, the point near (42.19, 4,134,002) represents the highest crude price observation at a very low trade count. The point (56.63, 3,911,469) also sits well above the regression line for its trade count range.
Confounding Factors and Interpretive Caveats
The most important caveat is the axis labeling inconsistency: the X-axis is labeled as "Total Trade Count" from a Cboe dataset, yet the Y-axis is labeled as "DCOILBRENTEU" (Brent crude oil price), but the dataset descriptions appear transposed — Brent crude is listed as the X-axis source dataset and Cboe volume as the Y-axis source. This labeling ambiguity warrants verification before drawing substantive conclusions. Beyond this, 2009 was an extraordinary macroeconomic year — marked by the tail end of the global financial crisis, a dramatic crude oil price recovery from late-2008 lows, and unusual volatility in equity markets — all driven by common macroeconomic forces (risk appetite, Federal Reserve policy, global demand expectations) that could simultaneously influence both variables. This is a classic spurious correlation through shared confounders: both series likely respond to broader macro conditions rather than directly influencing each other, which the failed Granger causality tests support. Additionally, daily frequency matching between oil spot prices and equity trade counts assumes perfect date alignment, and any misalignment would distort the correlation.
Actionable Insights and Further Investigation
Given these findings, several follow-up analyses are warranted. First, resolve the dataset labeling discrepancy to ensure axes represent what they claim. Second, investigate the extreme outlier at approximately (75.15, 629,671) — whether this reflects a data entry error, a holiday/low-liquidity session, or genuine market conditions will materially affect the regression. Third, researchers should introduce macroeconomic control variables — such as the VIX (volatility index), S&P 500 returns, USD/EUR exchange rates, or Fed funds rate changes — to test whether the negative correlation persists after accounting for shared macro drivers. Fourth, a rolling-window correlation analysis across sub-periods of 2009 (Q1 crisis period vs. Q3-Q4 recovery) could reveal whether the relationship was stable throughout the year or driven by a specific regime. Finally, extending the dataset beyond 2009 would test whether this relationship is structurally persistent or a feature unique to the post-crisis environment.
X dataset: Brent Crude Oil Prices: Daily (DCOILBRENTEU) – FRED St. Louis Fed
Y dataset: Cboe U.S. Equities Historical Market Volume Data 2009
Part of experiment: Daily - Brent Crude Oil Prices: Daily (DCOILBRENTEU) – FRED St. Louis Fed vs Cboe U.S. Equities Historical Market Volume Data 2009