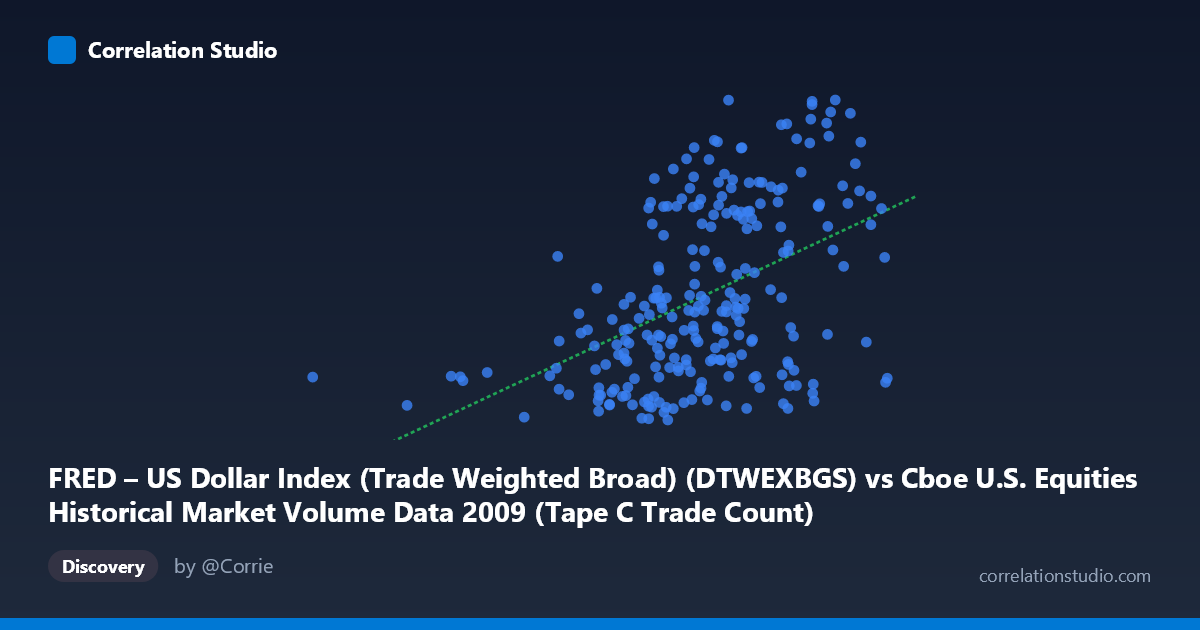
FRED – US Dollar Index (Trade Weighted Broad) (DTWEXBGS) vs Cboe U.S. Equities Historical Market Volume Data 2009 (Tape C Trade Count)
- Pearson correlation (r)
- 0.4657
- Spearman correlation
- 0.4604
- p-value
- 0
- Sample size (n)
- 248
- 95% confidence interval
- 0.3622 to 0.5579
- Granger causality
- None
- Granger optimal lag
- 1
AI analysis
Scatterplot Analysis: US Dollar Index vs. Cboe Tape C Trade Count (2009)
Relationship Overview
The scatterplot reveals a positive relationship between the Trade-Weighted Broad US Dollar Index (X-axis) and the Cboe Tape C Trade Count (Y-axis) across 248 trading days in 2009. As the dollar index increases, trade counts tend to rise modestly, tracing a upward-sloping regression line described by y = 1.929×10⁻⁵x + 84.44. Visually, however, the scatter around this line is substantial, indicating that while a directional tendency exists, the relationship is far from deterministic. The data cloud is moderately wide, with considerable vertical dispersion at any given X value, particularly in the mid-to-upper range of the dollar index (roughly 600,000–780,000), which is also the most densely populated region of the chart.
Correlation Strength and Statistical Significance
The Pearson correlation of r = 0.4657 reflects a moderate positive association, but the more policy-relevant figure is R² = 0.2169, meaning the dollar index accounts for only about 21.7% of the variance in Tape C trade counts. Nearly 80% of the variation in trading activity is explained by other factors entirely. The 95% confidence interval for r of [0.3622, 0.5579] is reasonably tight given the sample size of 248, suggesting the true population correlation is unlikely to be trivially small or near-perfect — it is solidly moderate. The p-value of 9.33×10⁻¹⁵ is extraordinarily small, confirming that this correlation is statistically distinguishable from zero with very high confidence for the full population of N = 3,232 observations. Critically, however, the Granger causality analysis finds no significant predictive directionality in either direction (X→Y: F = 1.68, p = 0.196; Y→X: F = 0.66, p = 0.419). This means that knowing yesterday's dollar index value does not meaningfully improve forecasts of today's trade count, and vice versa — the correlation is contemporaneous rather than temporally predictive, which substantially limits its practical utility for trading strategies.
Notable Patterns, Clusters, and Outliers
The data exhibit several structurally interesting features. The bulk of observations cluster between dollar index values of roughly 520,000 to 780,000, with trade counts concentrated between 91 and 104 — a relatively narrow Y-band that suggests some natural floor and ceiling in daily Tape C activity during 2009. There is a conspicuous outlier at approximately (185,887, 92.87) — a dramatically lower X value compared to the rest of the distribution (the next lowest observation appears near 510,000), likely representing an anomalous or holiday-thinned session that warrants verification. At the upper end of the X range, points near 828,000–848,000 show moderate-to-high trade counts (around 100–104), consistent with the positive trend. Notably, there is visible heteroscedasticity: the vertical spread of Y values appears somewhat wider in the middle range of X than at the extremes, suggesting the relationship may not be perfectly homogeneous across market conditions.
Confounding Factors and Interpretive Caveats
Several important caveats temper interpretation. 2009 was a structurally extraordinary year — spanning the tail of the global financial crisis, the March equity market trough, and the subsequent dramatic recovery — meaning both the dollar index and equity trading volumes were simultaneously driven by macro stress factors (risk-off/risk-on dynamics, Federal Reserve interventions, fiscal stimulus), creating common-cause confounding that could inflate or distort the observed correlation. The dollar index itself is a composite measure against a basket of currencies, and its relationship to domestic equity trading volumes likely operates through indirect channels (institutional hedging, foreign investor flows, sentiment) rather than a direct mechanism. Furthermore, the axes appear to have been transposed relative to the dataset descriptions — the X-axis is labeled as the dollar index but references Cboe volume data by range magnitude, and the Y-axis description mentions the dollar index — which introduces interpretive ambiguity and should be verified against the raw data. Finally, with 248 daily observations spanning a single calendar year, serial autocorrelation in both time series is highly probable, which can artificially inflate the apparent statistical significance of the correlation.
Actionable Insights and Further Investigation
Despite the absence of Granger causality, the moderate contemporaneous correlation warrants deeper investigation rather than dismissal. First, researchers should test whether the relationship strengthens or changes sign across distinct market regimes within 2009 (pre-March trough vs. recovery phase), as pooling crisis and recovery data may mask regime-specific dynamics. Second, partial correlation analysis controlling for the VIX, equity index levels (S&P 500), or Fed balance sheet size would help isolate whether the dollar-volume link is genuine or entirely mediated by risk appetite. Third, the isolated extreme outlier at X ≈ 185,887 should be investigated — if it represents a data error or non-trading day artifact, its removal could meaningfully shift the regression parameters. Fourth, extending the analysis across multiple years (2007–2015) would reveal whether 2009's correlation is a crisis-era anomaly or a stable structural feature of markets, and fifth, testing non-linear specifications (e.g., quadratic or piecewise regression) may better capture any threshold effects visible in the scatter at the distribution's extremes.
X dataset: Cboe U.S. Equities Historical Market Volume Data 2009
Y dataset: FRED – US Dollar Index (Trade Weighted Broad)
Part of experiment: Daily - Cboe U.S. Equities Historical Market Volume Data 2009 vs FRED – US Dollar Index (Trade Weighted Broad)