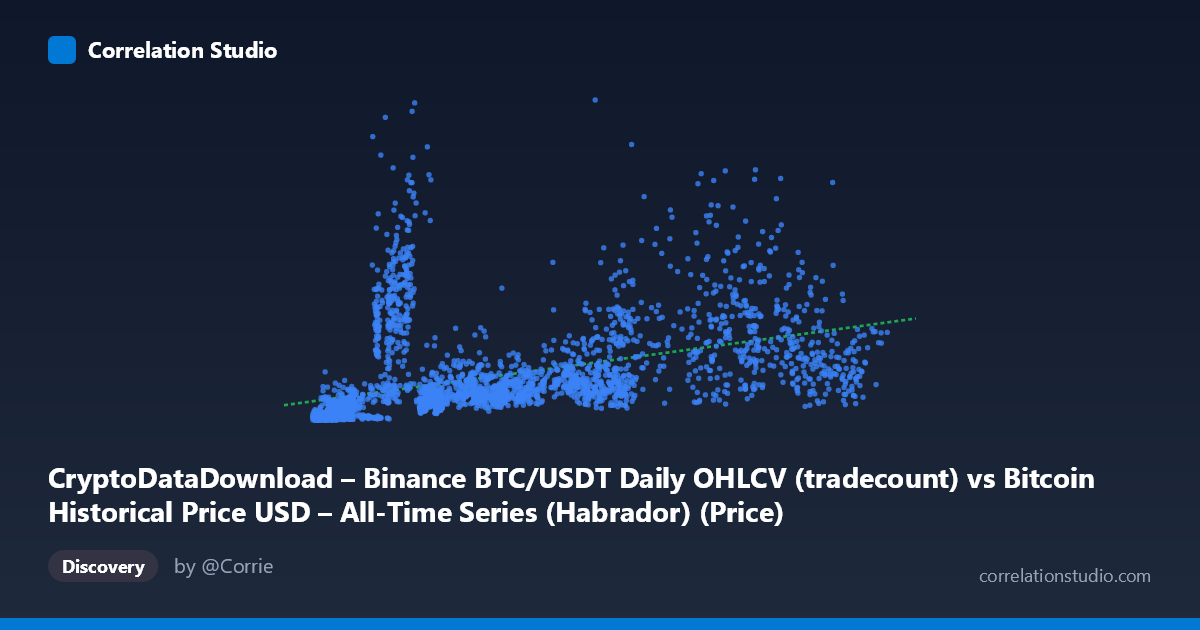
CryptoDataDownload – Binance BTC/USDT Daily OHLCV (tradecount) vs Bitcoin Historical Price USD – All-Time Series (Habrador) (Price)
- Pearson correlation (r)
- 0.449
- Spearman correlation
- 0.7479
- p-value
- 0
- Sample size (n)
- 3169
- 95% confidence interval
- 0.4208 to 0.4764
- Granger causality
- None
- Granger optimal lag
- 10
AI analysis
Analysis: BTC/USDT Trade Count vs. Bitcoin Price
1. What the Visualization Reveals
The scatterplot compares Binance daily trade count (X) against BTC/USDT price (Y) across roughly 3,169 daily observations spanning 2017–2026. At a glance, the relationship is positive but noisy and clearly non-linear: low trade-count days cluster tightly at low prices, but as trade count rises, price outcomes fan out dramatically — some high-price days occur at moderate trade counts (e.g., 23,449 trades paired with $8M price), while some high trade-count days sit at comparatively modest prices (e.g., 115,830 trades → $1.7M). This heteroscedastic "funnel" or "fan" shape is the dominant visual signature, not a tight linear band.
2. Strength, Direction, and Statistical Confidence
The Pearson correlation (r = 0.449) indicates a moderate positive linear association, with r² = 0.202 meaning only about 20% of the variance in price is explained by trade count in a linear framework — leaving roughly 80% unexplained. The 95% CI [0.421, 0.476] is fairly tight given the large sample, and the p-value (effectively 0) confirms the correlation is highly statistically significant — but statistical significance here reflects sample size, not practical predictive power. Critically, the Granger causality tests show no significant predictive direction in either direction (X→Y: p = 0.94; Y→X: p = 0.087, borderline but not significant at conventional thresholds). This means neither variable reliably helps forecast future values of the other once past values of both are accounted for — the correlation is likely driven by both series trending together over time (a shared temporal/market-cycle factor) rather than one causing or leading the other.
3. Notable Patterns and Non-linear Features
The note that Spearman ρ exceeds Pearson r is important: it signals the true relationship is monotonic but curved rather than straight-line. This is consistent with the data — trade count values cluster densely at the low end (under 50,000) while price spans nearly four orders of magnitude ($2,153 to $15.36M in Y, though this Y range looks unusually large relative to typical BTC prices and may include scaling/currency-unit artifacts). A log-transform of one or both axes would likely straighten the relationship substantially, consistent with typical crypto market behavior where trading activity and price both scale multiplicatively during bull/bear cycles rather than additively.
4. Confounding Factors and Caveats
Several caveats limit causal interpretation: - Shared time trend: Both trade count and price are driven by overall market cycles (bull/bear regimes, adoption growth), creating spurious correlation without direct causal linkage. - Volatility clustering: High-price/high-volatility periods often coincide with high trading activity, but this reflects mutual dependence on market sentiment, not one causing the other. - Scale/unit ambiguity: The Y range (up to $15.36M) is inconsistent with historical BTC/USDT prices, suggesting possible data merge issues, unit errors, or an unintended cumulative/aggregated field — this should be verified before drawing conclusions. - Non-stationarity: Both series likely have trends and volatility regimes that violate assumptions of standard correlation/Granger tests; differencing or detrending is advisable.
5. Actionable Recommendations
- Verify data integrity first — confirm the Y-axis units and check for merge/join errors producing the anomalously high price values. - Re-run correlation and Granger tests on log-transformed and/or differenced (returns) series to address non-linearity and non-stationarity, which likely inflates the current linear r² estimate's irrelevance. - Segment by market regime (bull vs. bear cycles) to see if the relationship strengthens or weakens conditionally. - Given the lack of Granger causality, avoid using trade count as a leading indicator for price forecasting in its current form; consider alternative volume/liquidity proxies or higher-frequency data where microstructure effects may reveal genuine lead-lag relationships.
X dataset: Bitcoin Historical Price USD – All-Time Series (Habrador)
Y dataset: CryptoDataDownload – Binance BTC/USDT Daily OHLCV
Part of experiment: Bitcoin - Bitcoin Historical Price USD – All-Time Series (Habrador) vs CryptoDataDownload – Binance BTC/USDT Daily OHLCV