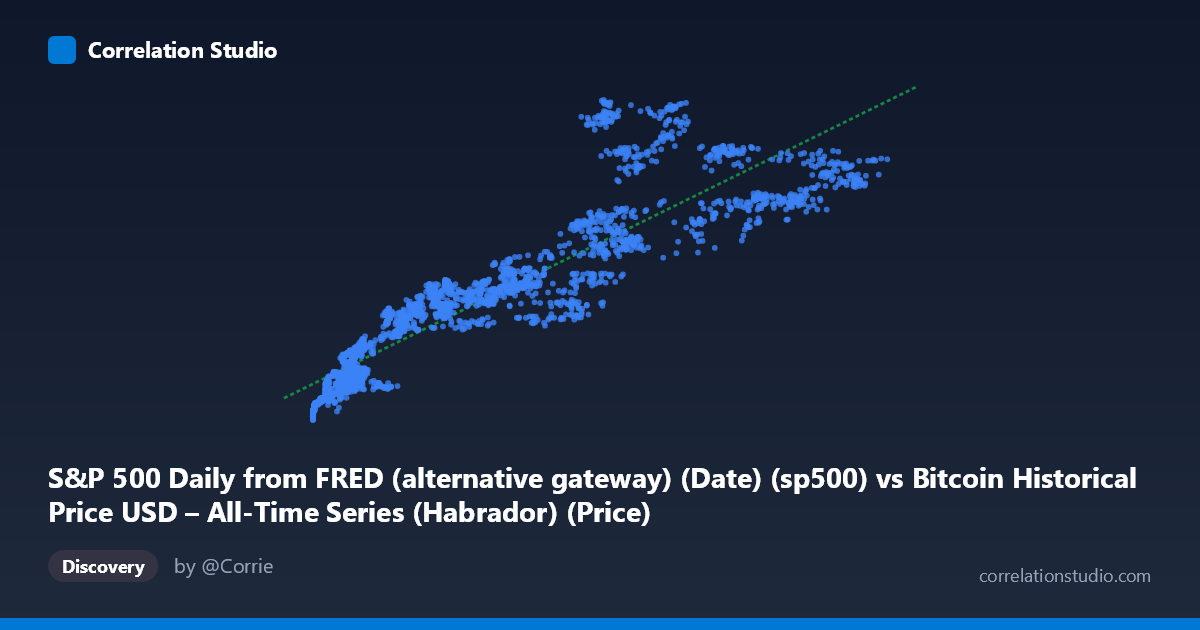
S&P 500 Daily from FRED (alternative gateway) (Date) (sp500) vs Bitcoin Historical Price USD – All-Time Series (Habrador) (Price)
- Pearson correlation (r)
- 0.9079
- Spearman correlation
- 0.9551
- p-value
- 0
- Sample size (n)
- 2486
- 95% confidence interval
- 0.9007 to 0.9145
- Granger causality
- X → Y
- Granger optimal lag
- 10
- Time coverage
- 2016-10-24 to 2026-09-15
- Recomputed on refreshed data
- 2026-10-24 (r was 0.9362)
AI analysis
Analysis: Bitcoin Price vs. S&P 500 Relationship
1. What the Visualization Reveals
The scatterplot displays a strong, positive, and visually curvilinear relationship between Bitcoin price (X-axis) and the S&P 500 (Y-axis) across a decade of data (2016–2026). Rather than a tight linear band, the data shows a pattern where Y (S&P 500) rises steeply at low X values, then the relationship flattens somewhat as X grows into the tens of thousands — suggestive of a log-like or saturating curve rather than a strict straight-line relationship, even though a linear model still fits reasonably well.
2. Strength, Direction, and Statistical Confidence
The correlation is strong and positive (r = 0.937), with r² = 0.879 indicating that roughly 88% of the variance in the S&P 500 series is statistically associated with variance in Bitcoin's price (or vice versa) over this sample. The 95% CI [0.932, 0.942] is tight, and the p-value is effectively 0 — meaning this correlation is highly unlikely to be due to sampling noise, especially at n = 2,497. However, correlation strength should not be mistaken for causal mechanism: the Granger causality tests show no significant predictive direction (Bitcoin→S&P500: p = 0.0585, borderline but not significant at 0.05; S&P500→Bitcoin: p = 0.208, clearly not significant). This means neither series reliably helps forecast the other's future movements based on past values — the strong contemporaneous correlation is likely driven by both assets responding to shared external forces (e.g., macro liquidity, interest rates, risk sentiment) rather than one causing the other.
3. Notable Patterns and Outliers
The data reveals distinct clustering rather than a smooth continuum: a dense cluster of points at low X (roughly 500–15,000) corresponding to Y in the 2,100–3,400 range — likely reflecting Bitcoin's 2016–2019 price era alongside a rising but calmer stock market. A second cluster appears at higher X (50,000–125,000) paired with Y in the 5,000–7,000+ range, representing more recent bull-market periods. Notably, some points break the trend: e.g., X=115,160 pairs with Y=6,345, while X=69,953 pairs with a higher Y=6,781 — indicating that at similar or higher Bitcoin prices, S&P 500 values don't always scale proportionally, hinting at decoupling episodes (likely Bitcoin-specific rallies/crashes independent of equities). This non-monotonic segment suggests real curvature/heteroscedasticity, with wider Y spread at high X values.
4. Confounding Factors and Caveats
This is a classic case of two trending time series being spuriously correlated due to shared temporal drift rather than genuine interdependence. Both Bitcoin and the S&P 500 have exhibited long-term upward trends over 2016–2026, driven by common macro factors: near-zero interest rates and QE (2020–21), inflation/rate-hike cycles (2022+), risk-on/risk-off sentiment, and broad dollar liquidity conditions. Since both series are non-stationary (trending), standard Pearson correlation is inflated and doesn't reflect a stable structural relationship — this is reinforced by the null Granger causality result. Additionally, daily/periodic misalignment, differing volatility regimes (Bitcoin is far more volatile), and potential data gaps (weekends/holidays for S&P 500 vs. 24/7 Bitcoin trading) may introduce alignment noise.
5. Actionable Insights and Further Investigation
Given the non-stationarity concern, analysts should avoid using this raw correlation for trading or hedging decisions. Instead: (1) test both series for unit roots (e.g., ADF test) and consider using log returns instead of price levels — this often eliminates spurious trend-driven correlation and reveals the "true" short-term co-movement; (2) rerun correlation and Granger tests on detrended/differenced data; (3) investigate specific macro regime periods (e.g., 2020 COVID crash, 2022 rate hikes) separately, since pooling a decade may mask regime-dependent relationships; (4) explore whether a third variable (e.g., real interest rates, DXY, M2 money supply) better explains the shared variance, which would clarify this as a confounded rather than causal relationship.
X dataset: Bitcoin Historical Price USD – All-Time Series (Habrador)
Y dataset: S&P 500 Daily from FRED (alternative gateway) (Date)
Part of experiment: Bitcoin - Bitcoin Historical Price USD – All-Time Series (Habrador) vs S&P 500 Daily from FRED (alternative gateway) (Date)