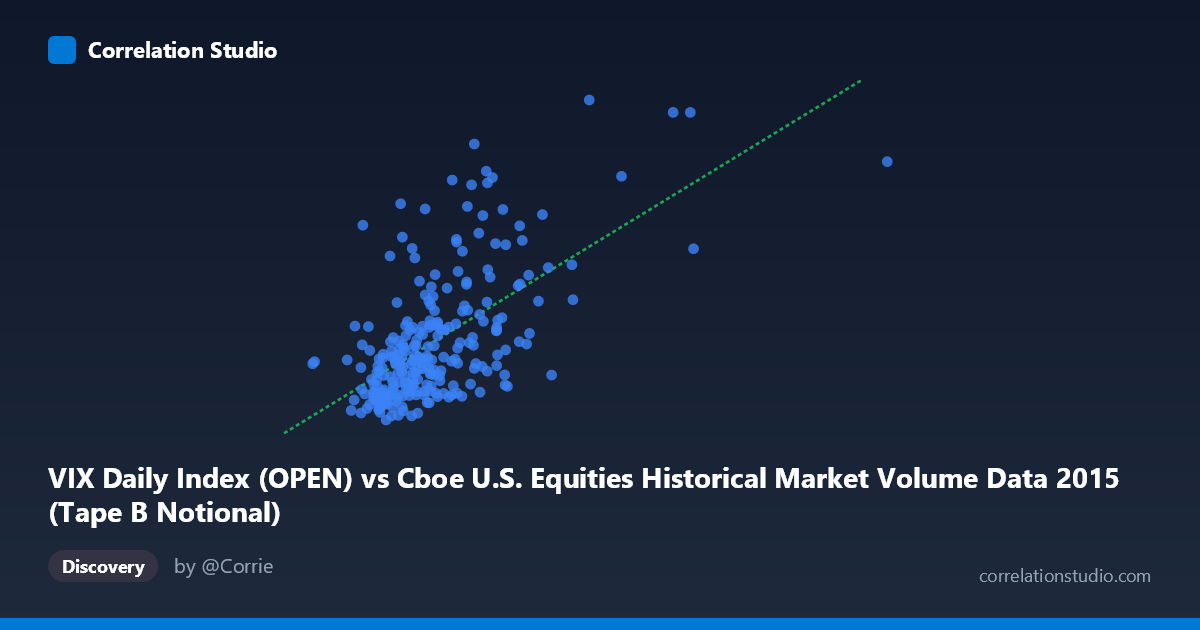
VIX Daily Index (OPEN) vs Cboe U.S. Equities Historical Market Volume Data 2015 (Tape B Notional)
- Pearson correlation (r)
- 0.6114
- Spearman correlation
- 0.5629
- p-value
- 0
- Sample size (n)
- 252
- 95% confidence interval
- 0.5277 to 0.6833
- Granger causality
- None
- Granger optimal lag
- 1
AI analysis
Analysis: VIX Daily Index (Open) vs. Tape B Notional Value (2015)
Relationship Overview The scatterplot reveals a moderate positive relationship between the CBOE VIX Daily Index open values and Tape B notional trading volume in U.S. equities markets during 2015. As VIX levels rise — indicating higher expected market volatility — Tape B notional values tend to increase correspondingly. This is an intuitively sensible relationship: elevated fear or uncertainty in markets (as measured by VIX) typically drives heavier trading activity and larger notional flows across equity exchanges. The linear regression equation (y = 1.40226E-09x + 9.053) suggests a shallow but meaningful upward slope, with the relationship becoming more pronounced at higher VIX readings.
Correlation Strength and Statistical Significance The Pearson correlation of r = 0.611 reflects a moderate positive association, but the r² of 0.374 is the more sobering figure — only 37.4% of the variance in Tape B notional volume is explained by VIX open levels, leaving roughly 62.6% attributable to other factors. The 95% confidence interval of [0.528, 0.683] is reasonably tight and does not approach zero, and with a p-value effectively at 0 across a paired sample of 252 observations (drawn from a population of 3,302), the relationship is statistically robust and unlikely to be a chance finding. However, the Granger causality results tell a critical story: neither direction (X→Y nor Y→X) shows significant temporal predictability (F = 0.115, p = 0.735 for X→Y; F = 0.603, p = 0.438 for Y→X). This means that while VIX and Tape B notional are contemporaneously correlated, knowing yesterday's VIX does not meaningfully help predict today's notional volume, and vice versa. The relationship is associative, not predictive in a temporal lead-lag sense.
Notable Patterns, Clusters, and Outliers The scatterplot shows notable heteroscedasticity: data points are relatively tightly clustered at lower VIX values (roughly 11–18 range), but variance in Tape B notional expands considerably at higher VIX readings. Several high-leverage points are visible in the upper-right quadrant — particularly observations near VIX values of 12–13 billion with Tape B notional exceeding 25–31 (e.g., the point near (12,491,974,395, 31.13) and (12,581,025,906, 22.55)) — which likely correspond to the market stress episodes of August 2015, when the S&P 500 experienced a sharp correction. The dense cluster of points between VIX opens of 3–7 billion with notional values of 12–20 represents the more "normal" trading environment that dominated most of 2015. These outlier stress-period observations may be disproportionately driving the observed correlation coefficient upward.
Confounding Factors and Interpretive Caveats Several important caveats apply. First, the axis assignment appears inverted from conventional expectation: VIX is on the X-axis and market volume (Tape B notional) is on the Y-axis, yet VIX is typically considered a consequence of or concurrent indicator with market conditions rather than an independent driver of volume in a simple causal sense. Second, 2015 was not a typical year — it included the August 2015 "flash crash" and significant China-related volatility, which creates extreme observations that inflate the apparent correlation. Third, Tape B notional specifically covers NYSE American and regional exchange-listed securities, which may respond differently to volatility regimes than broader market measures. Fourth, common drivers — macroeconomic news events, Federal Reserve announcements, and algorithmic trading patterns — likely act as confounders, simultaneously moving both VIX and notional volumes without one causing the other. The non-Granger-causal result reinforces this interpretation.
Actionable Insights and Further Investigation Practitioners should be cautious about using VIX levels as a real-time predictor of Tape B notional activity, given the absence of Granger causality. A more productive investigation would involve segmenting the data by volatility regime (low/medium/high VIX terciles) to determine whether the correlation strengthens materially during stress periods — the visual evidence suggests it does. Researchers should also consider non-linear modeling (e.g., a log-log or piecewise regression), since the heteroscedastic fan shape implies a multiplicative rather than additive relationship at higher volatility levels. Additionally, incorporating intraday timing, options expiration cycles, and Fed announcement calendars as covariates would help decompose the unexplained 62.6% of variance. Finally, extending this analysis across multiple years would help determine whether the 2015 correlation structure is representative or an artifact of that year's specific stress events.
X dataset: Cboe U.S. Equities Historical Market Volume Data 2015
Y dataset: VIX Daily Index
Part of experiment: Daily - Cboe U.S. Equities Historical Market Volume Data 2015 vs VIX Daily Index