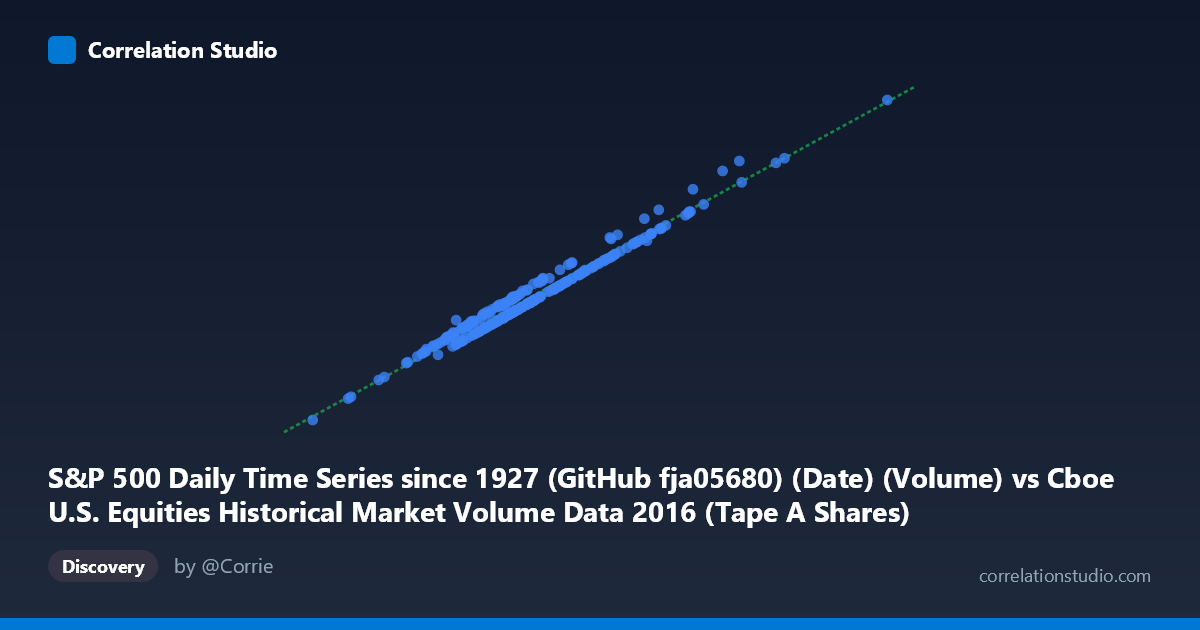
S&P 500 Daily Time Series since 1927 (GitHub fja05680) (Date) (Volume) vs Cboe U.S. Equities Historical Market Volume Data 2016 (Tape A Shares)
- Pearson correlation (r)
- 0.9875
- Spearman correlation
- 0.9774
- p-value
- 0
- Sample size (n)
- 252
- 95% confidence interval
- 0.984 to 0.9902
- Granger causality
- None
- Granger optimal lag
- 10
AI analysis
Analysis: S&P 500 Trading Volume vs. Cboe Tape A Shares (2016)
Relationship Overview The scatterplot reveals a remarkably tight, positive linear relationship between total U.S. equity market volume (X-axis, from the S&P 500 daily time series) and Cboe Tape A shares traded (Y-axis). The data points cluster closely around the regression line (y = 13.509x + 2.241×10⁸), with very little visible scatter. This strong co-movement suggests that Tape A share volume — representing NYSE-listed securities — rises and falls in near-lockstep with aggregate market volume across all U.S. equity venues throughout the 2016 trading year.
Correlation Strength and Statistical Significance The correlation is exceptionally strong at r = 0.9875, and critically, the R² of 0.9752 means that 97.5% of the variance in Tape A shares is explained by total market volume — leaving only ~2.5% attributable to other factors. The 95% confidence interval [0.984, 0.990] is narrow, confirming high precision in this estimate, and the p-value of effectively zero across 252 paired observations makes any chance explanation implausible. However, the Granger causality tests tell a more nuanced story: neither direction (X→Y: F=0.667, p=0.755; Y→X: F=0.511, p=0.882) shows statistically significant temporal predictive power at the optimal 10-period lag. This means that while the two series move together contemporaneously with extraordinary consistency, neither one reliably leads the other in time — the relationship is synchronous rather than predictive.
Patterns, Clusters, and Outliers The sample points span X values roughly from ~176M to ~363M shares, with Y ranging correspondingly from ~2.65B to ~5.08B Tape A shares. The distribution appears fairly continuous with moderate density in the 220M–310M volume range, consistent with the reported mean of ~272M. A few points at the upper right (e.g., ~363M, 5.08B and ~339M, 4.75B) represent high-volume days — likely coinciding with volatility events such as post-Brexit ripples or FOMC announcements in 2016 — but these points remain on or very near the regression line, indicating no meaningful breakdown in the linear relationship even during market stress. No substantial outliers or non-linear curvature are evident.
Confounding Factors and Caveats Several interpretive caveats apply. First, this is fundamentally a compositional relationship: Tape A shares are a subset of total U.S. equity volume, so some degree of correlation is mathematically embedded by construction — the two series are not fully independent. Second, both variables are driven by common underlying forces — macroeconomic news, volatility regimes (VIX), algorithmic trading activity, and calendar effects (e.g., quarter-end rebalancing) — making it difficult to attribute the correlation to any direct causal mechanism. Third, the 2016 time window is a single calendar year, limiting generalizability; structural shifts such as exchange rule changes or ETF proliferation could alter this relationship in other periods.
Actionable Insights and Further Investigation Despite the lack of Granger causality, the near-perfect contemporaneous relationship has practical utility: total market volume serves as an excellent real-time proxy for Tape A activity, which could simplify modeling or risk estimation when only aggregate data is available. For further investigation, analysts should: (1) extend the time series across multiple years to test whether R² stability holds across different market regimes; (2) decompose residuals to identify the ~2.5% unexplained variance — those deviations may correspond to venue market-share shifts or dark pool activity changes; (3) test at shorter intraday lags (e.g., 1–3 periods) for Granger causality, since the 10-period optimal lag may obscure faster lead-lag dynamics; and (4) control for VIX as a covariate to assess whether volatility mediates the relationship or represents the primary common driver.
X dataset: Cboe U.S. Equities Historical Market Volume Data 2016
Y dataset: S&P 500 Daily Time Series since 1927 (GitHub fja05680) (Date)
Part of experiment: Daily - Cboe U.S. Equities Historical Market Volume Data 2016 vs S&P 500 Daily Time Series since 1927 (GitHub fja05680) (Date)