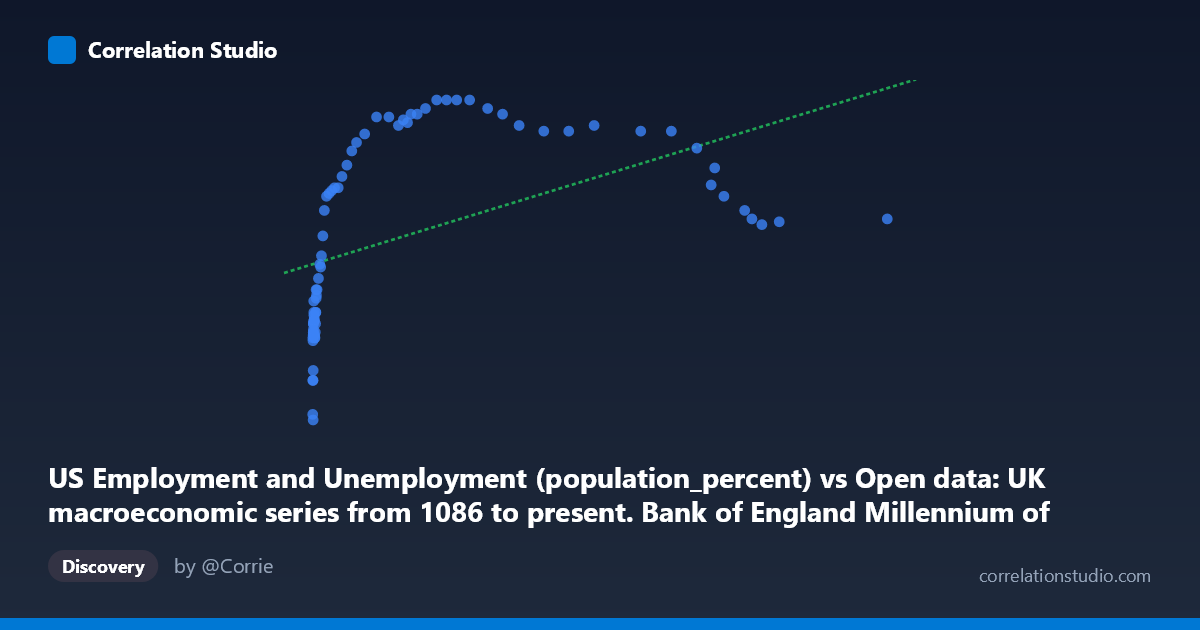
US Employment and Unemployment (population_percent) vs Open data: UK macroeconomic series from 1086 to present. Bank of England Millennium of Macroeconomic Data. (Month) (value)
- Pearson correlation (r)
- 0.4851
- Spearman correlation
- 0.8279
- p-value
- 0.000008
- Sample size (n)
- 77
- 95% confidence interval
- 0.2929 to 0.6396
- Granger causality
- None
- Granger optimal lag
- 1
- Time coverage
- 1941-01-01 to 2017-01-01
AI analysis
Scatterplot Analysis: UK Macroeconomic Data vs. US Employment Rate
1. Overall Relationship Pattern
The scatterplot reveals a positive but notably non-linear relationship between the X variable (UK macroeconomic series values, likely a nominal monetary or financial series given its enormous range from ~164 to ~116,836) and the Y variable (US employment/unemployment population percentage, ranging narrowly from ~55.8% to ~67.1%). The data points exhibit a clear logarithmic or saturation-curve pattern: Y values rise steeply as X increases from its lower range (roughly 164–5,000), then plateau and flatten considerably as X enters the higher ranges (20,000–116,836). This visual "leveling off" is the dominant structural feature of the chart and immediately signals that a linear model is an inadequate descriptor of this relationship.
2. Correlation Strength, Direction, and Temporal Causality
The Pearson correlation of r = 0.4851 indicates a moderate positive association, but the coefficient of determination r² = 0.2353 tells a more sobering story — the linear model explains only 23.5% of the variance in Y, leaving over three-quarters of Y's variability unaccounted for. The 95% confidence interval of [0.2929, 0.6396] is relatively wide, spanning from weak-to-moderate all the way to moderately strong, reflecting meaningful uncertainty about the true population correlation despite statistical significance. The p-value of 7.79 × 10⁻⁶ confirms the relationship is highly unlikely to be due to chance alone, given n = 77 paired observations. However, statistical significance here is largely a function of sample size and does not imply practical or causal importance. Critically, the Granger causality tests show no significant predictive direction in either direction (X→Y: F = 1.26, p = 0.265; Y→X: F = 1.93, p = 0.169), meaning that neither variable meaningfully predicts the other's future values at a one-period lag. This substantially undermines any interpretation of a directional or mechanistic link between these two series in the temporal domain.
3. Notable Patterns, Clusters, and Outliers
The data naturally clusters into two broad regimes. A dense lower-left cluster contains the majority of observations with X values below ~5,000, where Y values span a wide range (roughly 56%–64%), showing high within-cluster variability. A sparser upper cluster with X values above ~20,000 shows Y values tightly bunched between approximately 62%–67.1%, with several points at exactly 67.1% (e.g., X ≈ 25,333; 27,334; 29,405; 32,033) suggesting possible data discretization or rounding at the upper bound. Notable potential outliers include the point at (164.44, 56.00) — the lowest values on both axes — and (243.92, 55.80), which sits conspicuously below the main cluster. On the high-X end, values like (116,836, 62.90) and (94,899, 62.80) are surprisingly moderate in Y despite extreme X values, consistent with the saturation pattern. The Spearman ρ exceeding Pearson r formally confirms this non-linearity, strongly suggesting a logarithmic transformation of X would substantially improve model fit.
4. Confounding Factors and Interpretive Caveats
Several serious caveats apply here. First, the axis labels suggest a potential dataset mismatch: the X-axis is labeled as "US Employment and Unemployment (populationpercent)" yet appears to contain values in the tens of thousands — far outside any plausible population percentage — while the Y-axis labeled as a UK macroeconomic value shows values consistent with employment percentages (55–67%). This raises the possibility that the axes or dataset assignments may be swapped or mislabeled, which would fundamentally alter interpretation. Second, the temporal coverage (1941–2017) spans dramatic structural breaks including WWII, post-war expansion, the oil shocks, deindustrialization, and the Global Financial Crisis — all of which independently affect both UK and US macroeconomic conditions, creating substantial spurious correlation driven by shared secular trends. Third, both series likely contain strong autocorrelation and common long-run trends (e.g., economic growth over decades), making standard correlation misleading without detrending. Finally, with N = 86 but only n = 77 paired observations, approximately 9 data points are unmatched, potentially introducing selection bias.
5. Actionable Insights and Further Investigation
Given the clear non-linearity, the immediate priority should be re-fitting with a logarithmic model (y = a·ln(X) + b), which would almost certainly yield a substantially higher R² and better capture the observed saturation curve. Researchers should also verify and clarify the axis labels and dataset alignment, as the apparent mismatch between variable names and value ranges is a critical data quality concern. To address spurious correlation from shared trends, first-differencing or HP-filtering both series before computing correlations would help isolate genuine co-movement from common drift. Extending the Granger causality analysis to longer lags (2–5 periods) may reveal delayed predictive relationships not captured at lag 1. Finally, given the two-regime clustering pattern, segmented or piecewise regression — treating low-X and high-X observations separately — could reveal whether the relationship differs structurally across the two groups, and regime-specific analysis tied to historical economic periods (pre/post 1980, pre/post 2008) would add meaningful economic context to what is currently a largely correlational observation.
X dataset: Open data: UK macroeconomic series from 1086 to present. Bank of England Millennium of Macroeconomic Data. (Month)
Y dataset: US Employment and Unemployment
Part of experiment: Yearly - Open data: UK macroeconomic series from 1086 to present. Bank of England Millennium of Macroeconomic Data. (Month) vs US Employment and Unemployment