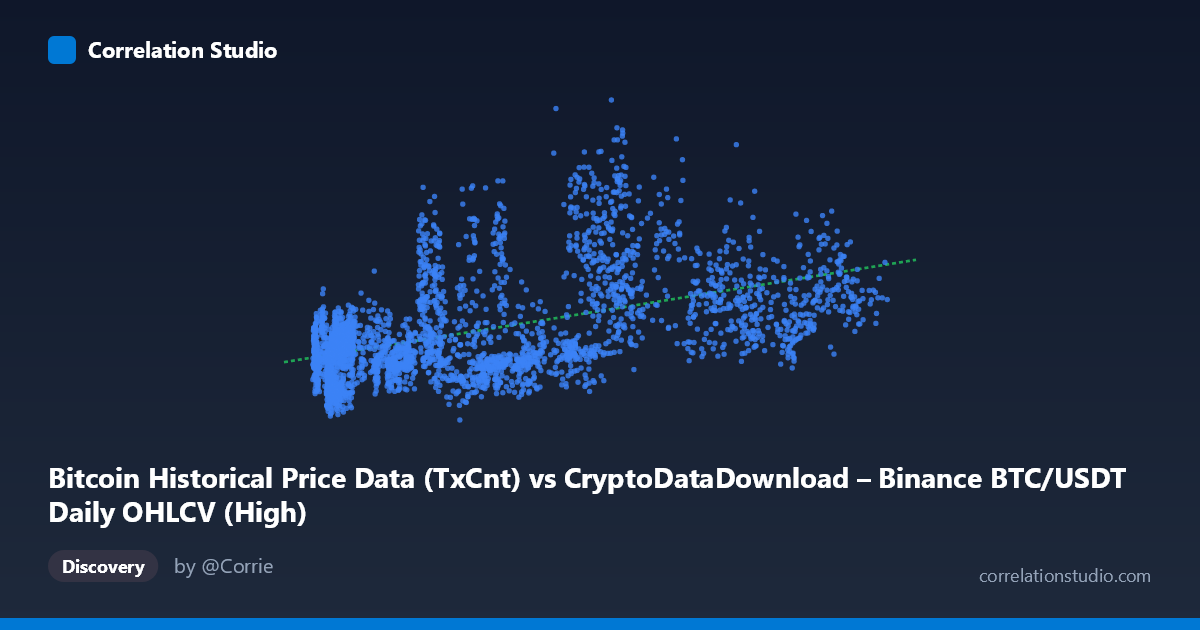
Bitcoin Historical Price Data (TxCnt) vs CryptoDataDownload – Binance BTC/USDT Daily OHLCV (High)
- Pearson correlation (r)
- 0.5005
- Spearman correlation
- 0.5041
- p-value
- 0
- Sample size (n)
- 3191
- 95% confidence interval
- 0.474 to 0.5261
- Granger causality
- None
- Granger optimal lag
- 10
AI analysis
Analysis: Bitcoin Transaction Count vs. BTC/USDT High Price
1. Overview of the Relationship
The scatterplot depicts a moderate positive association between Bitcoin's daily transaction count (X) and the daily high price of BTC/USDT (Y). Points generally trend upward from lower-left to upper-right, but the dispersion is substantial — at any given transaction count level (e.g., ~10,000), Y values range widely from roughly 130,000 to over 400,000, indicating that transaction count alone is a weak predictor of price on any single day.
2. Strength, Direction, and Statistical Confidence
The correlation coefficient (r = 0.50) indicates a moderate positive linear relationship, with R² = 0.25 meaning only 25% of the variance in price highs is explained by transaction count — the remaining 75% is driven by other factors. The 95% CI [0.474, 0.526] is tight, and the p-value (~0) confirms this correlation is statistically robust and not due to chance, largely a function of the large sample size (n=3,191). However, statistical significance should not be conflated with practical predictive strength — R² of 0.25 is modest.
Critically, the Granger causality tests show no significant predictive direction in either direction (X→Y: p=0.63; Y→X: p=0.87). This means past transaction counts do not help forecast future prices, nor do past prices help forecast future transaction activity, at least at the tested lag structure (10 periods). This strongly suggests the correlation is contemporaneous/structural rather than causal or predictive — both variables likely respond to a common underlying driver (e.g., overall market growth, adoption cycles, or time trend) rather than one leading the other.
3. Patterns and Outliers
The data shows a clear fan-shaped/heteroscedastic pattern: variance in Y increases as X increases, particularly noticeable in the mid-range of X (40,000–90,000), where price highs span from ~270,000 to over 700,000. This suggests regime-dependent behavior — likely reflecting different market cycles (e.g., 2020-21 bull run vs. 2022 bear market vs. 2024-25 rally) where similar transaction volumes coincided with vastly different price levels. Several notable points sit as outliers relative to the linear fit — e.g., (42899, 724837) and (28783, 492845) show unusually high prices for their transaction counts, likely from bull-market periods, while points like (39380, 182420) show low prices despite moderate activity, likely from bear-market conditions.
4. Confounding Factors and Caveats
The most significant confound is time itself: since this spans 2017–2026, both variables are likely non-stationary and trending upward over the long term due to overall Bitcoin ecosystem maturation, independent of any causal link. This is a classic case of spurious correlation via a shared trend — both series may be integrated (I(1)) processes that correlate simply because they both grow over time, not because they mechanistically interact. Additionally, transaction count on-chain doesn't necessarily reflect trading activity on Binance specifically, creating a mismatch between the causal mechanism (on-chain usage) and the traded asset price. Market regime shifts (halvings, regulatory events, macro conditions) act as confounders affecting both series simultaneously.
5. Recommendations
- Detrend or difference both series (e.g., use % changes or log-differences) before assessing correlation/causality to remove the shared time trend and test for genuine short-term co-movement. - Segment by market regime (bull/bear/sideways periods) to check if the r=0.50 correlation is stable or driven by specific high-volatility periods. - Given the null Granger result, do not use transaction count as a leading indicator for trading signals in its current form; consider testing other on-chain metrics (active addresses, hash rate, exchange inflows) or shorter/longer lag structures. - Investigate a nonlinear or interaction model (e.g., quantile regression) given the heteroscedastic fan pattern, since a single linear slope poorly captures the relationship across different price regimes.
X dataset: CryptoDataDownload – Binance BTC/USDT Daily OHLCV
Y dataset: Bitcoin Historical Price Data
Part of experiment: Bitcoin - CryptoDataDownload – Binance BTC/USDT Daily OHLCV vs Bitcoin Historical Price Data