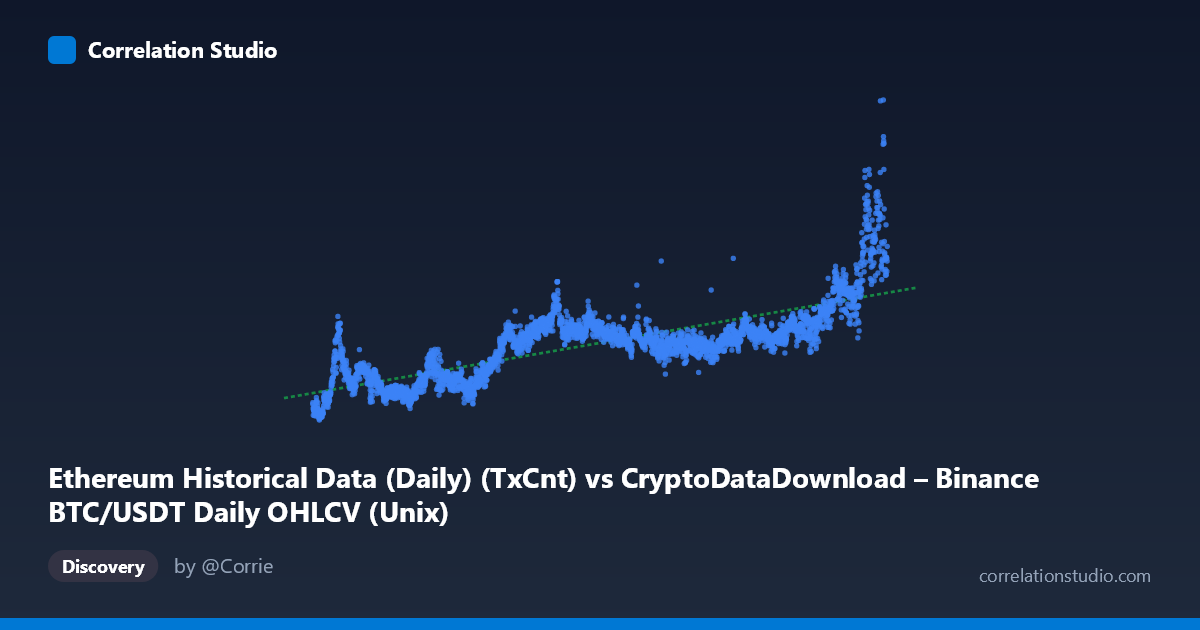
Ethereum Historical Data (Daily) (TxCnt) vs CryptoDataDownload – Binance BTC/USDT Daily OHLCV (Unix)
- Pearson correlation (r)
- 0.7683
- Spearman correlation
- 0.7636
- p-value
- 0
- Sample size (n)
- 3191
- 95% confidence interval
- 0.7537 to 0.7822
- Granger causality
- None
- Granger optimal lag
- 10
AI analysis
Analysis: Ethereum Transaction Count vs. Time-Indexed Metric
Note on labeling: The axis labels appear swapped or mismatched in the metadata — the X-axis is described as Ethereum transaction count but shows Unix timestamps spanning 2017–2026, while Y-axis is labeled as "Unix" but shows values consistent with a transaction count metric. I'll treat X as the time dimension and Y as the daily transaction/activity metric, which aligns with the actual data structure.
1. What the Visualization Reveals
The scatterplot shows a clear long-term upward trend in the Y variable (transaction counts, ranging ~260K to ~3.6M) across the full time span (2017–2026). The data is not linear but shows distinct regime shifts: relatively low, flat values through 2018–2020 (~300K–1M), a moderate plateau through 2021–2023 (~900K–1.3M), and a steep acceleration from 2024 onward, with values jumping to 2M–3.6M. This pattern suggests structural growth phases rather than smooth continuous scaling.
2. Strength, Direction, and Statistical Confidence
The correlation coefficient (r = 0.768) indicates a strong positive relationship, with r² = 0.590 meaning time explains about 59% of the variance in the transaction metric — a substantial but incomplete fit, leaving 41% of variation driven by other factors (volatility, adoption cycles, network events). The 95% CI [0.754, 0.782] is tight, and p ≈ 0 confirms this relationship is highly statistically significant and not a product of chance, unsurprising given the large sample (n=3,191). However, the Granger causality tests show no significant predictive direction in either direction (X→Y: p=0.080; Y→X: p=0.209) at the 10-lag horizon tested. This is expected and mechanically important: since X is essentially a time index, Granger causality is not meaningful here — time doesn't "cause" in a dynamic sense, it merely orders observations. The real causal question would require testing Y against another substantive variable (e.g., BTC price/volume), not against time itself.
3. Notable Patterns and Outliers
The most striking feature is the non-linear, regime-shifting growth: the linear model (R²=0.59) underfits both the flat early period and the steep late-period acceleration, since a straight line poorly captures S-curve or exponential adoption dynamics. Sample points from 2024–2026 (e.g., 2.4M–3.6M) sit well above what linear extrapolation from earlier years would predict, suggesting a recent structural break — possibly a new bull cycle, network upgrade, or adoption surge. Early 2018 points (~300K) form a distinct low cluster. The residual spread also appears heteroscedastic — variance around the trend likely increases in later periods given wider swings (e.g., 1.4M vs. 2M+ in nearby 2025 timestamps).
4. Confounding Factors and Caveats
Since X is a time variable, this is fundamentally a trend analysis, not a causal relationship — "time" doesn't drive transaction counts; underlying drivers (price rallies, gas fee changes, DeFi/NFT activity, exchange listings, macroeconomic crypto sentiment) do, and these are omitted. The mismatched axis labels also raise concern about whether the BTC/ETH dataset pairing is correctly specified — verify that Y is genuinely ETH transaction count and not artifact of a merge/join error. Additionally, daily crypto data is well-known for autocorrelation and volatility clustering, which violates independence assumptions underlying standard r/p-value calculations, likely inflating apparent significance.
5. Suggested Next Steps
- Fix axis/column labeling to confirm what's truly being measured before drawing conclusions. - Replace linear regression with a piecewise, logarithmic, or exponential growth model to better capture the regime shifts and improve fit beyond 59%. - Test Granger causality between ETH transaction count and BTC price/volume (not time) to explore genuine cross-asset predictive relationships. - Segment analysis by clear regime periods (2018–2020, 2021–2023, 2024+) to identify distinct growth-phase drivers. - Apply differencing or detrending to address autocorrelation before any further statistical inference.
X dataset: CryptoDataDownload – Binance BTC/USDT Daily OHLCV
Y dataset: Ethereum Historical Data (Daily)
Part of experiment: Bitcoin - CryptoDataDownload – Binance BTC/USDT Daily OHLCV vs Ethereum Historical Data (Daily)