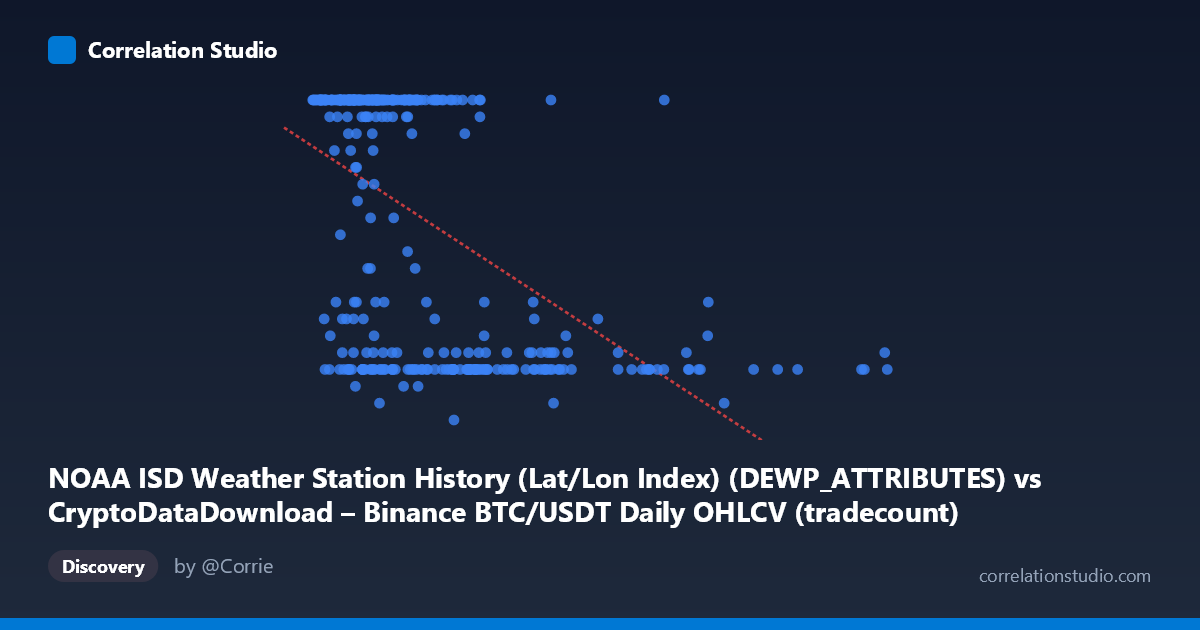
NOAA ISD Weather Station History (Lat/Lon Index) (DEWP_ATTRIBUTES) vs CryptoDataDownload – Binance BTC/USDT Daily OHLCV (tradecount)
- Pearson correlation (r)
- -0.5352
- Spearman correlation
- -0.534
- p-value
- 0
- Sample size (n)
- 355
- 95% confidence interval
- -0.6055 to -0.4565
- Granger causality
- None
- Granger optimal lag
- 1
AI analysis
Analysis: Cross-Domain Variable Correlation
Important preliminary note: The column labels in this dataset appear mismatched or mislabeled — the X-axis is described as weather station DEWPATTRIBUTES but contains values in the range of BTC/USDT price-like magnitudes (562,832 to 12,012,364), while the Y-axis is described as "tradecount" but contains small integer values (5-24) resembling a bounded index or attribute code rather than trade counts. This mismatch is critical context: the statistical relationship being measured likely does not represent what the labels claim, and any substantive interpretation should be treated cautiously until the data provenance is clarified.
1. Relationship Overview The scatterplot shows a moderate negative association between X and Y. As X increases, Y tends to decrease, though the relationship is far from deterministic — there is substantial scatter around the trend line. The regression line (y = -1.95E-06x + 22.34) has a shallow negative slope, meaning large absolute changes in X correspond to relatively small shifts in Y, consistent with X's very large scale (in the millions) compared to Y's compact 5-24 range.
2. Strength, Direction, and Statistical Confidence The correlation coefficient (r = -0.535) indicates a moderate negative relationship. The r² of 0.286 tells us X explains only about 28.6% of the variance in Y — meaning over 70% of Y's variability is driven by other factors not captured by this simple linear relationship. The 95% CI [-0.606, -0.457] is reasonably tight and entirely negative, and the p-value of ~0 confirms this correlation is highly unlikely due to chance given n=355. However, Granger causality tests show no significant predictive direction in either direction (X→Y: p=0.786; Y→X: p=0.335). This is an important distinction: correlation exists, but neither variable helps forecast the other over time. This suggests the relationship may be contemporaneous/structural rather than causal-temporal, or that the "time" framing is not meaningful for these variables.
3. Patterns and Clusters Looking at the sample points, Y appears to cluster heavily at two levels: a dense cluster at Y=24 (the apparent ceiling) and a secondary cluster around Y=7-12, with fewer points in between (e.g., 17, 19, 21). This bimodal clustering suggests Y may be a capped, categorical, or discretized variable rather than a continuous measurement — consistent with a bounded index (0-24) rather than a trade count (which would typically follow a right-skewed continuous distribution with no such ceiling). Additionally, X values above ~5,000,000 correspond almost exclusively to low Y values (8-10), while the dense mid-range X values (1-3 million) populate both high and low Y — suggesting a possible threshold/breakpoint effect rather than a smooth linear decline.
4. Confounding Factors and Caveats Several caveats apply: (1) Label mismatch — the metadata describing DEWPATTRIBUTES and tradecount doesn't match the observed value ranges, raising serious data integrity concerns; (2) Ceiling effect at Y=24 may be artificially compressing variance and inflating the apparent negative correlation, since a real relationship would need room to vary; (3) the dataset combines two unrelated domains (crypto trading and weather stations) via what may be a join key or index rather than a substantive economic/physical relationship — this could be a spurious correlation from a mismatched join; (4) no Granger causality despite significant correlation strongly hints at either a shared underlying driver (confound) or an artifact of data structure (e.g., sorting/indexing effects) rather than a genuine dynamic relationship.
5. Recommended Next Steps Before drawing substantive conclusions: (1) Verify column mappings against the original source files — the label/value mismatch must be resolved first; (2) test whether Y is genuinely categorical/ordinal and switch to appropriate methods (e.g., ordinal logistic regression, chi-square) rather than Pearson r; (3) investigate the apparent ceiling/threshold at Y=24 and the breakpoint near X≈5,000,000 with segmented or piecewise regression; (4) check whether X and Y are both derived from a shared index (e.g., row order, date, or station ID) that could produce spurious correlation; (5) given the lack of Granger causality, avoid using this pair for predictive/forecasting purposes until the relationship is structurally better understood.
X dataset: CryptoDataDownload – Binance BTC/USDT Daily OHLCV
Y dataset: NOAA ISD Weather Station History (Lat/Lon Index)
Part of experiment: Bitcoin - CryptoDataDownload – Binance BTC/USDT Daily OHLCV vs NOAA ISD Weather Station History (Lat/Lon Index)