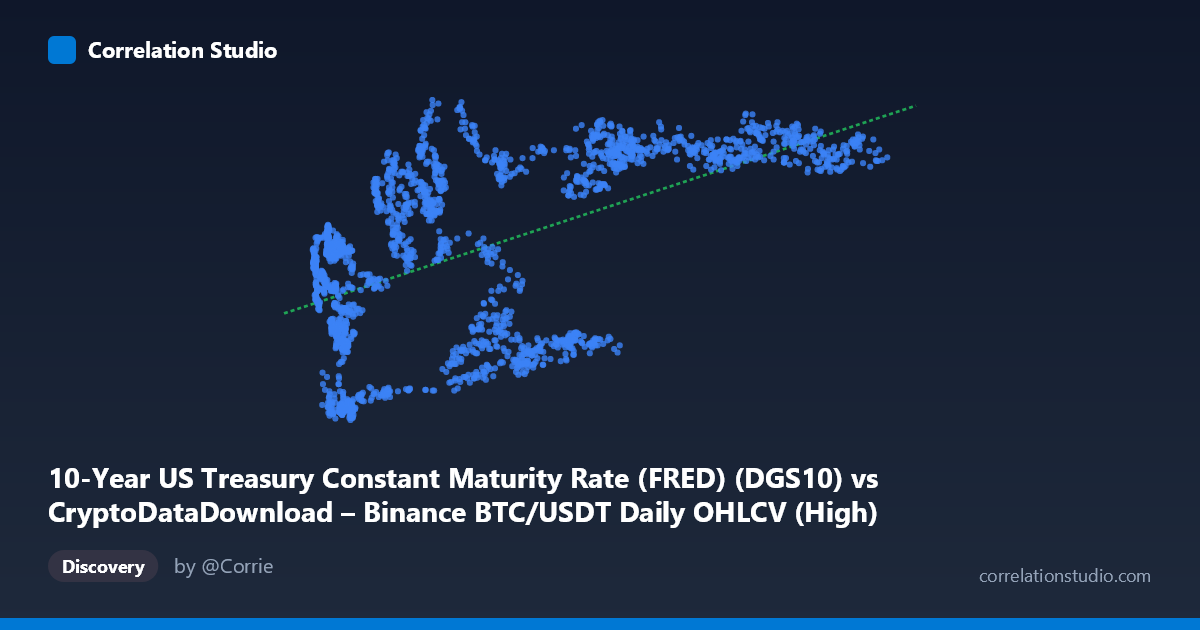
10-Year US Treasury Constant Maturity Rate (FRED) (DGS10) vs CryptoDataDownload – Binance BTC/USDT Daily OHLCV (High)
- Pearson correlation (r)
- 0.5685
- Spearman correlation
- 0.5448
- p-value
- 0
- Sample size (n)
- 2197
- 95% confidence interval
- 0.5395 to 0.5962
- Granger causality
- None
- Granger optimal lag
- 1
AI analysis
Analysis: BTC/USDT Price vs. 10-Year US Treasury Yield
Note on axis labeling: The metadata appears swapped — the values described as "X" (ranging ~3,335 to ~126,199) are clearly BTC/USDT prices, while "Y" (ranging 0.52 to 4.98) are the 10-Year Treasury yields. The analysis below treats X = BTC price and Y = Treasury yield accordingly.
1. What the Visualization Reveals The scatterplot shows a moderate positive association between Bitcoin price and the 10-Year Treasury yield: as BTC prices rise from the thousands into the six-figure range, yields tend to climb from below 1% toward the 4–5% range. However, the relationship is clearly non-linear and heteroscedastic — at low BTC prices (under $20,000), yield values are widely scattered (0.5 to 4.0+), while at high BTC prices (above $80,000), yields cluster tightly in the 4.0–4.7% band. This suggests the relationship strengthens/tightens at higher price levels rather than holding a constant linear slope throughout.
2. Strength, Direction, and Statistical Confidence The correlation coefficient (r = 0.566) indicates a moderate positive linear relationship, with R² = 0.320 meaning only about 32% of the variance in Treasury yields is explained by BTC price (or vice versa) — leaving roughly 68% of variance attributable to other factors. The 95% CI [0.537, 0.594] is fairly narrow given the large sample (n=2,183), and the p-value of ~0 confirms the correlation is statistically significant and not due to chance. However, statistical significance here reflects sample size more than practical predictive power — R² of 0.32 is a weak-to-moderate fit, not one suitable for confident forecasting. Critically, Granger causality tests show no significant predictive direction in either direction (X→Y: p=0.13; Y→X: p=0.66), indicating that despite the contemporaneous correlation, neither series reliably leads the other in time. This strongly suggests the relationship is driven by a shared underlying macro trend (e.g., both rising over the same multi-year period) rather than one causing the other.
3. Notable Patterns and Outliers Several distinct clusters emerge: a dense low-price/low-yield cluster (BTC < $15,000, yield 0.5–2.0%) corresponding to 2019–2020; a middle cluster with high scatter (BTC $15,000–50,000, yield 1.3–4.3%) reflecting the volatile 2021–2023 period where yields rose sharply while BTC fluctuated; and a high-price/high-yield cluster (BTC $80,000, yield ~4.0–4.7%) representing more recent data. Notable outliers include points like (34,881, 1.50) and (64,270, 1.56) — high BTC prices paired with unusually low yields — and (3,626, 2.66) — very low BTC price with a mid-range yield — indicating BTC price alone is a poor predictor of yield at certain points, especially during BTC-specific rallies/crashes decoupled from rate cycles.
4. Confounding Factors and Caveats This is a classic case of spurious correlation via shared time trend: both BTC price and Treasury yields have generally risen over 2017–2025, driven by entirely different macro forces (crypto adoption/halving cycles vs. Fed policy/inflation). Neither Granger-causes the other, reinforcing that a third factor — overall macroeconomic conditions, time itself, monetary policy regime shifts (post-COVID rate hikes coinciding with a BTC bull market) — likely drives both. Additionally, using daily OHLCV "High" prices introduces noise, and Treasury yields are far less volatile day-to-day than BTC, creating a mismatch in variance structure that can distort correlation estimates.
5. Suggestions for Further Investigation Given the lack of Granger causality, treating this as a predictive trading signal is unwarranted. Instead: (1) detrend both series (e.g., use year-over-year changes or differences rather than levels) to test if a genuine relationship exists independent of the shared upward trend; (2) segment the analysis by macro regime (pre/post-2022 rate hikes) to see if correlation sign or strength changes; (3) explore other explanatory variables (inflation expectations, Fed funds rate, equity market performance) that may better explain BTC price movements; and (4) consider non-linear or regime-switching models given the clear heteroscedasticity observed in the scatterplot.
X dataset: CryptoDataDownload – Binance BTC/USDT Daily OHLCV
Y dataset: 10-Year US Treasury Constant Maturity Rate (FRED)
Part of experiment: Bitcoin - CryptoDataDownload – Binance BTC/USDT Daily OHLCV vs 10-Year US Treasury Constant Maturity Rate (FRED)