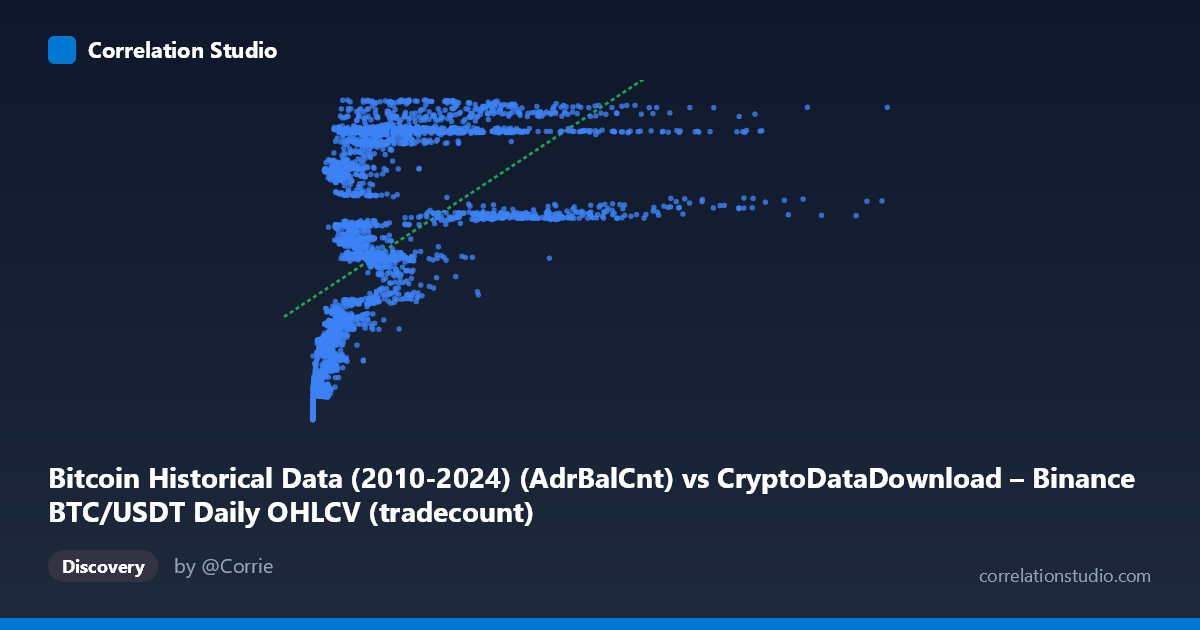
Bitcoin Historical Data (2010-2024) (AdrBalCnt) vs CryptoDataDownload – Binance BTC/USDT Daily OHLCV (tradecount)
- Pearson correlation (r)
- 0.5532
- Spearman correlation
- 0.7826
- p-value
- 0
- Sample size (n)
- 3191
- 95% confidence interval
- 0.5287 to 0.5769
- Granger causality
- None
- Granger optimal lag
- 10
AI analysis
Analysis: Bitcoin Active Address Count vs. Trade Count
1. What the Visualization Reveals
The scatterplot shows a moderate positive relationship between Bitcoin's active address count (AdrBalCnt) and Binance BTC/USDT daily trade count. Points form a loose upward-sloping band rather than a tight line, with substantial vertical scatter at nearly every X value — indicating that while higher address activity tends to coincide with higher trading activity, the relationship is noisy rather than deterministic. The data is notably compressed at low X values (a large cluster below X=2,000,000) with a long right tail extending to ~15.3 million, suggesting a heavily right-skewed X distribution.
2. Strength, Direction, and Uncertainty
The correlation coefficient (r = 0.553) indicates a moderate positive relationship, with R² = 0.306 meaning only about 30.6% of the variance in trade count is explained by address count — leaving nearly 70% driven by other factors (exchange-specific volume, volatility spikes, news events, derivative activity, etc.). The 95% CI [0.529, 0.577] is tight given the large sample (n=3,191), and the p-value of ~0 confirms this correlation is highly statistically significant and not due to chance — but statistical significance here reflects sample size more than practical strength. Critically, the Granger causality test shows no significant predictive direction in either direction (X→Y: p=0.078; Y→X: p=0.474). This means neither series reliably "leads" the other in time — the correlation appears to be a contemporaneous co-movement (likely both driven by overall market activity/adoption cycles) rather than one metric causing or forecasting the other.
3. Notable Patterns and Non-linear Features
Several features suggest linearity is a poor fit: - Dense low-X cluster: Most points sit below X=2M, where Y ranges enormously (19M–57M) for similar X values — implying a steep, possibly logarithmic relationship at low address counts. - Sparse high-X tail: Very few points exist beyond X=5M, but these show high Y values, hinting at saturation or a different regime at scale. - The note that Spearman ρ Pearson r is a strong signal of monotonic-but-nonlinear structure — likely logarithmic or power-law, consistent with typical blockchain metrics (address counts and transaction volumes often scale log-linearly). - Outliers include several points with very low X (near 0–10,000) paired with mid-range Y (~19–22M), representing early low-adoption periods still generating baseline trading activity on Binance.
4. Confounding Factors and Caveats
Several caveats limit causal interpretation: - Mismatched sources/scope: X measures on-chain Bitcoin network addresses (all BTC activity globally), while Y measures trades specifically on Binance's BTC/USDT pair — an indirect proxy relationship at best. - Time trend confounding: Both series likely trend upward with overall crypto market growth/adoption (2017–2026), so correlation may partly reflect a shared time trend rather than a direct mechanistic link. - Volatility clustering: Trade count often spikes during price volatility (independent of address growth), which could inflate scatter and weaken the linear fit. - Exchange-specific effects: Binance's market share, fee changes, or listing events could shift Y independently of on-chain activity.
5. Suggestions for Further Investigation
- Refit with log or power transformations (e.g., log(X) vs. Y, or log-log) given the Spearman/Pearson divergence and right-skewed X — this will likely substantially improve R². - Detrend both series (e.g., first-differencing or removing long-term growth trends) before re-running correlation/Granger tests to isolate short-term co-movement from shared secular growth. - Segment by market regime (bull/bear phases, volatility quantiles) to check if the relationship strengthens or weakens under different conditions. - Incorporate additional covariates (price volatility, overall market cap, exchange volume share) in a multivariate model to better isolate the marginal contribution of address activity to trade count.
X dataset: CryptoDataDownload – Binance BTC/USDT Daily OHLCV
Y dataset: Bitcoin Historical Data (2010-2024)
Part of experiment: Bitcoin - CryptoDataDownload – Binance BTC/USDT Daily OHLCV vs Bitcoin Historical Data (2010-2024)