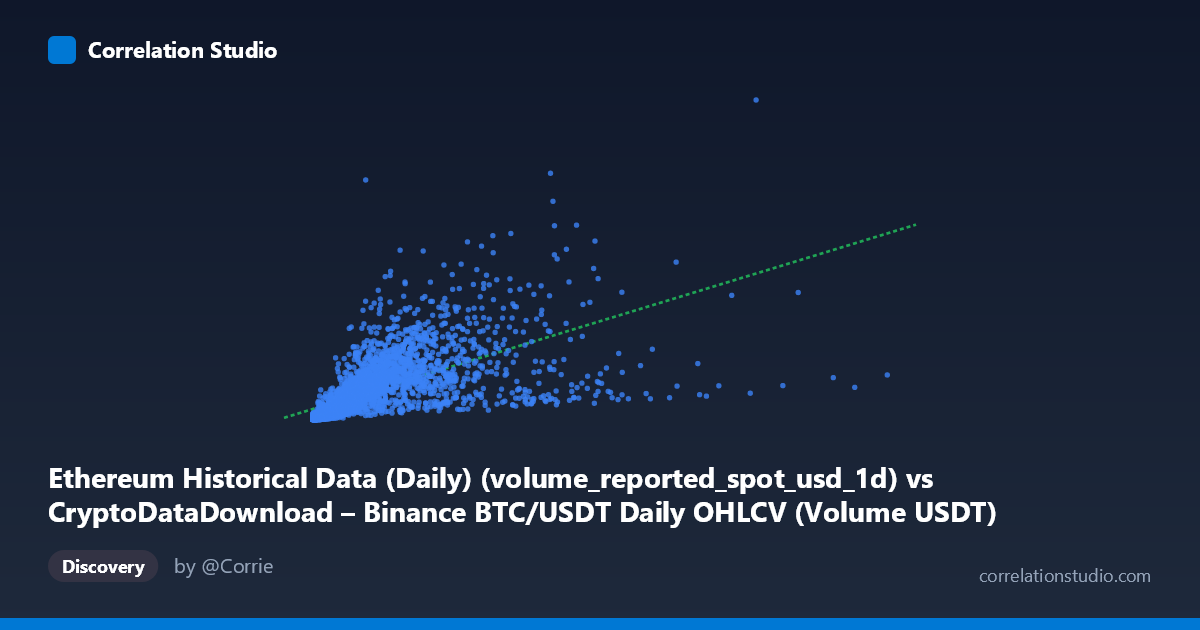
Ethereum Historical Data (Daily) (volume_reported_spot_usd_1d) vs CryptoDataDownload – Binance BTC/USDT Daily OHLCV (Volume USDT)
- Pearson correlation (r)
- 0.6198
- Spearman correlation
- 0.8551
- p-value
- 0
- Sample size (n)
- 3191
- 95% confidence interval
- 0.598 to 0.6407
- Granger causality
- None
- Granger optimal lag
- 10
- Time coverage
- 2017-08-17 to 2026-05-20
AI analysis
Analysis: Ethereum Volume vs. BTC/USDT Volume (Reported Spot USD)
1. What the Visualization Reveals
The scatterplot shows a positive but noisy relationship between reported spot USD trading volumes on two different markets/assets (BTC/USDT daily volume as X, and what appears to be a labeled "Ethereum" volume series as Y, though the axis metadata suggests both may actually trace back to Binance BTC/USDT OHLCV data — see caveats below). Points cluster heavily in the lower-left region (both variables under ~$5B), with a long right-tail of higher-volume days that pull the trend line upward. The relationship broadly follows an upward-sloping pattern but with substantial scatter around the fitted line, especially in the low-to-mid volume range.
2. Strength, Direction, and Statistical Confidence
The Pearson correlation (r = 0.62) indicates a moderate positive linear relationship, with r² = 0.384 meaning only 38.4% of the variance in Y is explained by X — the majority (61.6%) of Y's variability is driven by other factors or noise. The 95% CI [0.598, 0.641] is tight and does not cross zero, and the p-value (~0) confirms this correlation is highly statistically significant and not a product of chance, given the large sample (n=3,191). However, statistical significance here reflects sample size more than practical predictive strength — r² of 0.38 is a moderate, not strong, fit. Critically, the Granger causality tests show no significant predictive direction in either direction (X→Y: p=0.945; Y→X: p=0.199) at the optimal lag of 10 periods. This means neither series reliably leads the other in time — the correlation is likely driven by a shared external factor (e.g., overall crypto market volume/liquidity cycles) rather than one variable causing or forecasting the other.
3. Notable Patterns and Outliers
The data is strongly right-skewed: means (X: $1.75B, Y: $4.89B) sit well below the maxima (X: $17.5B, Y: $53.7B), and standard deviations exceed or approach the means, confirming heavy-tailed distributions typical of crypto volume data (driven by volatility spikes, news events, and liquidation cascades). The note that Spearman ρ likely exceeds Pearson r suggests the true relationship is monotonic but non-linear — likely a power-law or logarithmic form, common in volume-based financial data where both series expand multiplicatively during high-volatility regimes. Several sample points show Y values far exceeding what the linear fit predicts for their X value (e.g., X≈601M with Y≈5.4B), hinting at asset-specific volume spikes (e.g., ETH-specific news/gas fee events) decoupled from BTC volume.
4. Confounding Factors and Caveats
A major caveat: the dataset labeling is internally inconsistent — the X-axis metadata describes "Ethereum Historical Data" while the actual column references Binance BTC/USDT volume, and the Y-axis similarly cites "Binance BTC/USDT OHLCV" while labeled as Ethereum's dataset. This suggests possible mislabeling or a data pipeline error, which should be resolved before drawing asset-specific conclusions. Setting that aside, both series are volume metrics from overlapping crypto market conditions (2017–2026), so they share obvious confounders: overall market-wide liquidity, exchange-wide trading activity, bull/bear cycles, and macro crypto sentiment (e.g., ETF approvals, regulatory news) will inflate both BTC and ETH volumes simultaneously, inflating the correlation without implying any direct causal link between the two assets.
5. Actionable Insights
First, verify and correct the column/dataset labeling before further analysis. Second, given the skewed distributions, refit the model using log-transformed volumes (log-log regression) to test the suspected non-linear/power-law relationship, which should improve fit over the linear r²=0.38. Third, since Granger causality is absent, avoid using one series to forecast the other directly; instead, consider modeling both as outputs of a shared latent factor (e.g., total crypto market volume or a volatility index) using PCA or a common-factor time-series model. Finally, examine volume spikes/outliers by date to check for identifiable market events (halvings, hacks, regulatory announcements) that may explain the heavy-tail behavior and could be filtered or dummy-coded in future analysis.
X dataset: CryptoDataDownload – Binance BTC/USDT Daily OHLCV
Y dataset: Ethereum Historical Data (Daily)
Part of experiment: Bitcoin - CryptoDataDownload – Binance BTC/USDT Daily OHLCV vs Ethereum Historical Data (Daily)