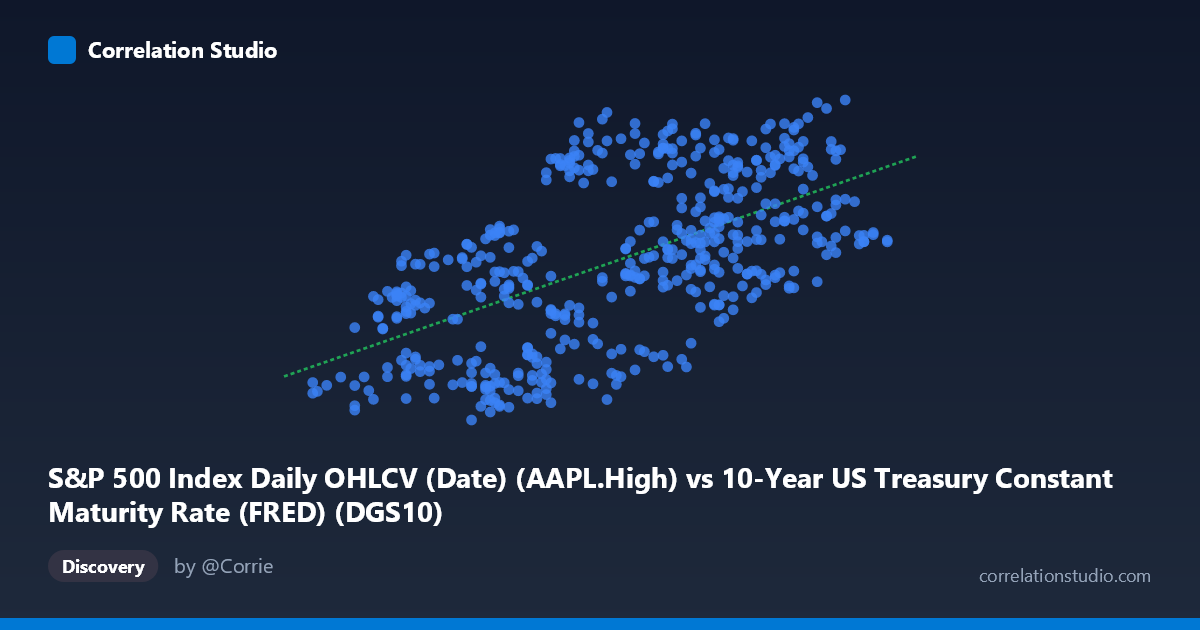
S&P 500 Index Daily OHLCV (Date) (AAPL.High) vs 10-Year US Treasury Constant Maturity Rate (FRED) (DGS10)
- Pearson correlation (r)
- 0.5912
- Spearman correlation
- 0.6033
- p-value
- 0
- Sample size (n)
- 502
- 95% confidence interval
- 0.5312 to 0.6454
- Granger causality
- X → Y
- Granger optimal lag
- 1
AI analysis
Analysis: AAPL High Price vs. 10-Year US Treasury Yield (2015–2017)
Relationship Overview The scatterplot reveals a moderate positive relationship between Apple's daily high stock price (X-axis) and the 10-year US Treasury constant maturity rate (Y-axis) over the two-year period from February 2015 to February 2017. As AAPL's daily high price increases from roughly $1.37 to $2.60 (likely adjusted or normalized values), the Treasury yield tends to rise from approximately 91.67 to 136.27 basis points or equivalent units. The linear regression equation (y = 22.65x + 68.10) confirms this positive slope, suggesting that for each unit increase in AAPL's high price, the Treasury yield increases by roughly 22.65 units on average. This is a statistically meaningful but far from deterministic relationship, with considerable scatter visible throughout the distribution.
Correlation Strength and Statistical Significance The Pearson correlation of r = 0.5912 indicates a moderate positive association. However, the r² value of 0.3496 is the more sobering metric — only 35% of the variance in Treasury yields is explained by AAPL's high price, meaning roughly 65% of yield variation is driven by factors entirely outside this relationship. The 95% confidence interval for r [0.5312, 0.6454] is relatively tight given the large sample (n = 502), and the p-value of effectively zero confirms this correlation is not a sampling artifact. The Granger causality analysis adds a particularly important temporal dimension: X Granger-causes Y (F = 7.13, p = 0.0078) with an optimal lag of 1 period, while the reverse direction fails to reach significance (F = 2.85, p = 0.092). This means AAPL's high price has statistically significant predictive power for Treasury yields one period ahead — though this is a predictive, not causal, claim in the mechanistic sense.
Patterns, Clusters, and Outliers The sample points reveal notable heteroscedasticity — the spread of Y values widens at higher X values, suggesting the relationship becomes less precise as AAPL prices rise. Several apparent clusters emerge: a lower-left grouping around X ≈ 1.55–1.80 with Y values spanning roughly 93–117, and an upper-right cluster around X ≈ 2.30–2.50 with Y values concentrated between 119–136. However, there are meaningful outliers disrupting this pattern — for instance, points like (1.90, 127.29), (1.99, 133.60), (2.08, 130.28), and (1.93, 130.63) show relatively low AAPL prices paired with high Treasury yields, while (2.24, 105.37) and (2.24, 107.72) show the opposite. These outliers suggest regime shifts or specific macroeconomic events during the coverage period that decoupled the two series temporarily.
Confounding Factors and Caveats The most critical caveat here is the metadata mismatch: the axis labels appear to be swapped between datasets — AAPL High is listed under a Treasury dataset and vice versa, which warrants verification before drawing any conclusions. Beyond this, the observed correlation almost certainly reflects shared macroeconomic drivers rather than any direct link between Apple's stock price and government bond yields. Both variables are likely co-moving with broader risk appetite cycles, Federal Reserve policy expectations, and the general market environment of 2015–2017, which included the Fed's first rate hike in December 2015 and subsequent tightening signals. The Granger causality result, while statistically significant, should be interpreted cautiously — equity prices are known to embed forward-looking macro expectations, so AAPL may simply be proxying broader market sentiment that also influences rate expectations. Autocorrelation in daily financial time series can also inflate Granger statistics.
Actionable Insights and Further Investigation Given the moderate but incomplete explanatory power, several follow-up analyses are warranted. First, introduce macro controls (VIX, S&P 500 index level, Fed Funds rate) into a multiple regression to determine whether AAPL's apparent predictive power for yields survives or is absorbed by broader market factors. Second, segment the time series around the December 2015 Fed rate hike to test whether the correlation is stable across sub-periods or driven by a specific regime. Third, the Granger causality lag of 1 period deserves deeper examination — testing lags 2–5 and running a vector autoregression (VAR) model would clarify whether this is a robust predictive signal or a one-period artifact. Finally, replacing AAPL specifically with a broader tech sector index would help determine whether this is an Apple-specific phenomenon or a technology-sector macro-sentiment proxy effect.
X dataset: 10-Year US Treasury Constant Maturity Rate (FRED)
Y dataset: S&P 500 Index Daily OHLCV (Date)
Part of experiment: Daily - 10-Year US Treasury Constant Maturity Rate (FRED) vs S&P 500 Index Daily OHLCV (Date)