Ethereum Historical Data (Daily) (HashRate) vs CryptoDataDownload – Binance BTC/USDT Daily OHLCV (Volume USDT)
- Pearson correlation (r)
- 0.6215
- Spearman correlation
- 0.7607
- p-value
- 0
- Sample size (n)
- 1855
- 95% confidence interval
- 0.5927 to 0.6487
- Granger causality
- None
- Granger optimal lag
- 1
- Time coverage
- 2017-08-17 to 2022-09-14
AI analysis
Analysis: Ethereum Hash Rate vs. Binance BTC/USDT Volume (USDT)
1. What the Visualization Reveals
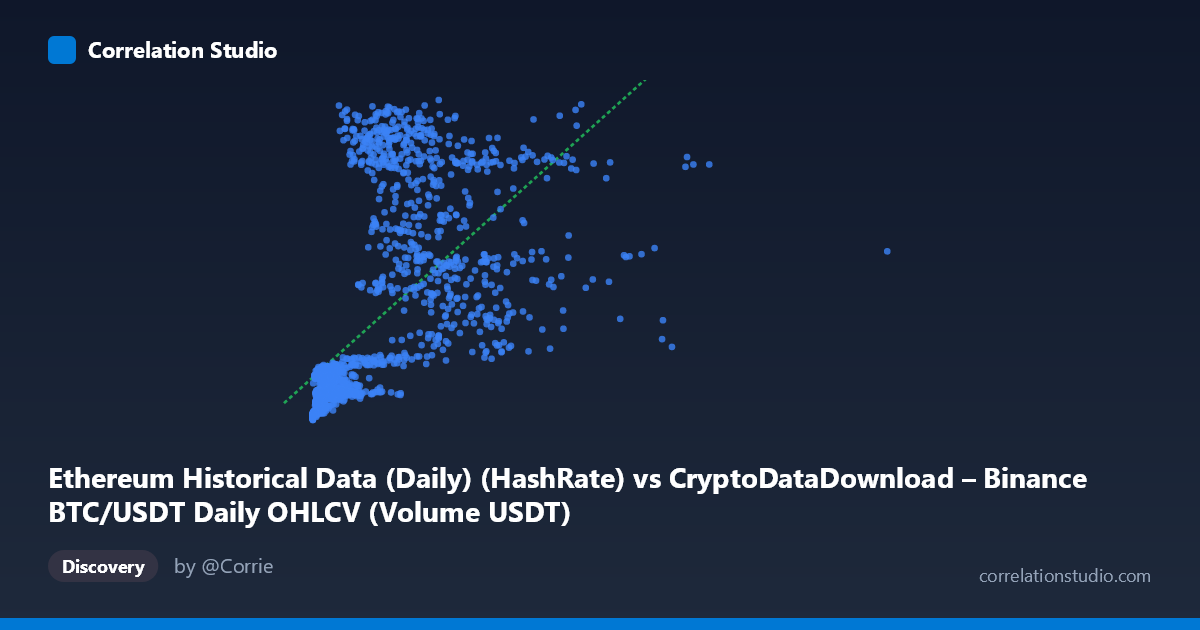
The scatterplot shows a moderate positive relationship between the two variables, with Y values generally rising as X increases, though with substantial scatter. The data is heavily right-skewed in X (range spans from ~978K to ~13.5 billion, with a mean of 1.26 billion but a median almost certainly much lower), meaning most points cluster at the low end of the X-axis while a long tail extends toward extreme values. This skew is typical of both hash rate metrics and trading volume data, which tend to grow non-linearly over time (e.g., through network growth, exchange adoption, or bull-market volume surges).
2. Strength, Direction, and Statistical Confidence
The Pearson correlation (r = 0.6215) indicates a moderate positive linear relationship, with r² = 0.386 meaning only 38.6% of the variance in Y is explained by X — leaving roughly 61% unexplained by this linear model. The 95% CI [0.593, 0.649] is tight given the large sample (n=1,855), and the p-value is effectively zero, so we can be confident the correlation is real and not due to chance — but "statistically significant" here is about certainty of some relationship, not its practical strength. A r² near 0.39 means this variable pair alone would be a weak-to-moderate predictor in any forecasting model.
Critically, the Granger causality tests show no significant predictive direction in either direction (X→Y: p=0.49; Y→X: p=0.40). This tells us that despite the contemporaneous correlation, neither series helps forecast the other's future values based on past values — the relationship is likely driven by a shared external trend (e.g., both series trending upward over the 2017–2022 period as crypto markets matured) rather than one causing or leading the other.
3. Notable Patterns and Outliers
The data shows clear signs of non-linearity: at low X values (< 1 billion), Y is tightly clustered in the 100–250 range, but as X increases, Y not only rises but its variance explodes dramatically — points like (1082530816, 1016.21) and (638275503, 970.62) show very high Y at relatively modest X values, while other similarly-sized X values correspond to Y under 250. This heteroscedastic fan-shaped pattern suggests the relationship isn't well-captured by a single linear fit. The note that Spearman ρ exceeds Pearson r supports this — a log-transformation of X (and possibly Y) would likely reveal a cleaner, more monotonic relationship, consistent with typical crypto market scaling behavior.
4. Confounding Factors and Caveats
Both series are components of a time series spanning a volatile 5-year period (2017–2022) that includes major bull runs (2017, 2021) and crashes (2018, 2022). Any two crypto-related metrics that grow over time will show spurious correlation purely from shared temporal trends, not causal linkage — this is a classic case of non-stationarity confounding correlation analysis. Additionally, mixing an Ethereum network metric (hash rate) with a Binance BTC/USDT trading metric (volume) means the relationship may be mediated by broader market sentiment/liquidity cycles affecting all crypto assets simultaneously, rather than any direct mechanistic link between ETH hash rate and BTC trading volume.
5. Suggestions for Further Investigation
- Detrend or difference both series (e.g., use daily % changes rather than levels) before computing correlation and Granger causality, to remove the shared-trend confound and test for genuine short-term co-movement. - Log-transform X (and consider log Y) given the extreme right-skew and the Spearman/Pearson divergence — refit with a log-linear or polynomial model to better capture the true functional form. - Segment by market regime (bull vs. bear periods) to check if the correlation strength is regime-dependent rather than stable across the full 2017–2022 window. - Given the lack of Granger causality, treat this as a contemporaneous/structural relationship at best (likely both driven by overall market growth/adoption), not a forecasting signal — any trading or predictive model should not rely on one metric to predict the other's future values.
X dataset: CryptoDataDownload – Binance BTC/USDT Daily OHLCV
Y dataset: Ethereum Historical Data (Daily)
Part of experiment: Bitcoin - CryptoDataDownload – Binance BTC/USDT Daily OHLCV vs Ethereum Historical Data (Daily)