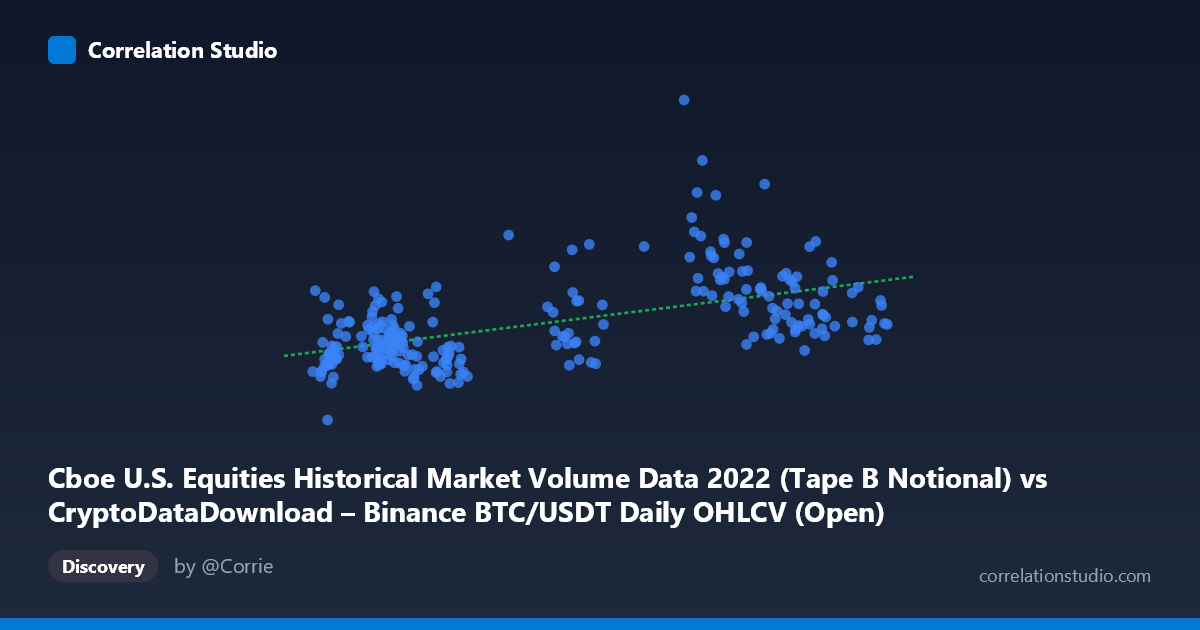
Cboe U.S. Equities Historical Market Volume Data 2022 (Tape B Notional) vs CryptoDataDownload – Binance BTC/USDT Daily OHLCV (Open)
- Pearson correlation (r)
- 0.5474
- Spearman correlation
- 0.5265
- p-value
- 0
- Sample size (n)
- 251
- 95% confidence interval
- 0.4544 to 0.6286
- Granger causality
- None
- Granger optimal lag
- 10
- Time coverage
- 2022-01-03 to 2022-12-30
AI analysis
Analysis of Cboe Equity Volume vs. Binance BTC/USDT Price Relationship
1. What the Visualization Reveals
The scatterplot displays a moderate positive relationship between Cboe U.S. equities notional trading volume (X-axis) and Binance BTC/USDT opening price (Y-axis) across 251 paired daily observations in 2022. As equity market volume increases, Bitcoin's price tends to rise as well, though the relationship shows considerable scatter rather than a tight linear band. The data suggests these two markets moved somewhat in tandem during this period, but with substantial independent variation.
2. Strength, Direction, and Statistical Confidence
The correlation coefficient (r = 0.547) indicates a moderate positive relationship, with r² = 0.2997 meaning only about 30% of the variance in Bitcoin's price is explained by equity volume levels — leaving 70% attributable to other factors entirely. The 95% confidence interval [0.454, 0.629] is reasonably tight and does not cross zero, and the p-value of ~0 confirms this correlation is statistically significant and not due to chance, given the sample size of 251. However, statistical significance should not be conflated with practical predictive power — a moderate r² means this relationship alone is insufficient for reliable forecasting.
Critically, the Granger causality tests show no significant predictive direction in either direction (X→Y: p=0.364; Y→X: p=0.232). This means neither variable's past values help forecast the other's future values in a time-series sense, even at an optimal lag of 10 periods. This is an important caveat: the contemporaneous correlation may reflect shared exposure to common macro factors (e.g., broad market sentiment, liquidity conditions, or volatility regimes) rather than one market driving the other.
3. Notable Patterns and Outliers
Several data points stand out with unusually high Y-values relative to their X-values — notably the cluster around X≈29,000–38,000 with Y exceeding $10–15 billion (e.g., 37988.01→14.2B, 40680.92→14.8B, 31017.11→11.6B). These appear to be BTC price spikes not matched by proportional equity volume increases, suggesting episodic decoupling, possibly tied to crypto-specific news events (regulatory announcements, exchange collapses — 2022 notably included the Terra/Luna and FTX crises). The bulk of points cluster in the lower-left-to-middle region (X: 16,000–24,000, Y: $4.5–8B), representing a denser, more linear core relationship, while higher-X observations (40,000) show more dispersion, hinting at potential heteroscedasticity.
4. Confounding Factors and Caveats
This correlation is likely spurious or indirect rather than causal. Both series are time-ordered financial data from 2022 — a year marked by aggressive Fed rate hikes, general risk-off sentiment, and crypto-specific shocks (Terra/Luna collapse in May, FTX collapse in November). Both equity volumes and BTC prices could be jointly driven by macro liquidity/risk conditions without directly interacting. Additionally, comparing an equities volume metric to a crypto price (not volume) mismatches units conceptually — apples-to-oranges comparison could be capturing shared volatility clustering during market stress rather than genuine economic linkage. The lack of Granger causality reinforces that this is unlikely to be a driver-follower relationship.
5. Suggestions for Further Investigation
To clarify whether this is a genuine or spurious relationship, analysts should: (1) test for correlation with a lagged/detrended VIX or crypto volatility index as a common confounder; (2) segment the data pre/post major 2022 crypto shocks (Luna, FTX) to see if the relationship is event-driven rather than continuous; (3) compare BTC price against equity price indices (e.g., S&P 500) rather than volume, and separately compare BTC volume against equity volume, for a more conceptually aligned pairing; and (4) apply cointegration tests (e.g., Engle-Granger) to check for a longer-run equilibrium relationship that daily Granger causality at lag 10 might miss.
X dataset: CryptoDataDownload – Binance BTC/USDT Daily OHLCV
Y dataset: Cboe U.S. Equities Historical Market Volume Data 2022
Part of experiment: Bitcoin - CryptoDataDownload – Binance BTC/USDT Daily OHLCV vs Cboe U.S. Equities Historical Market Volume Data 2022