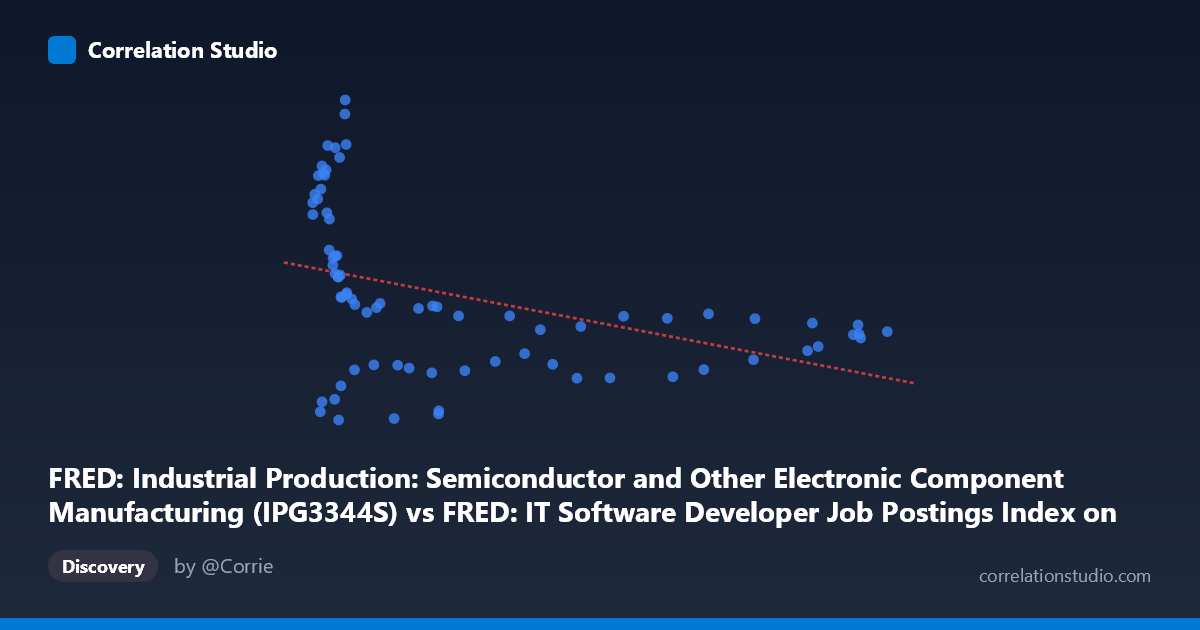
FRED: Industrial Production: Semiconductor and Other Electronic Component Manufacturing (IPG3344S) vs FRED: IT Software Developer Job Postings Index on Indeed (IHLIDXUSTPSOFTDEVE) (IHLIDXUSTPSOFTDEVE)
- Pearson correlation (r)
- -0.4165
- Spearman correlation
- -0.5799
- p-value
- 0.000165
- Sample size (n)
- 77
- 95% confidence interval
- -0.5858 to -0.2123
- Granger causality
- None
- Granger optimal lag
- 7
- Time coverage
- 2020-02-01 to 2026-06-01
- Recomputed on refreshed data
- 2026-10-25 (r was -0.4168)
AI analysis
Analysis: Semiconductor Production vs. Software Developer Job Postings
1. Overall Relationship Revealed by the Visualization
The scatterplot reveals a negative, moderately weak relationship between the Industrial Production Index for Semiconductors (X-axis) and the Software Developer Job Postings Index on Indeed (Y-axis). The linear regression line (y = -0.158x + 155.02) slopes downward, indicating that as semiconductor production increases, software developer job postings tend to decline. However, the data points show considerable scatter around this trend line, and a closer inspection reveals what appears to be a bimodal or clustered distribution — a dense cluster of observations at low X values (roughly 62–100) with highly variable Y values, and a more dispersed cluster at higher X values (roughly 130–235) where Y values converge toward the 117–135 range. This structural feature suggests the relationship may not be adequately captured by a simple linear model.
2. Correlation Strength, Direction, and Statistical Significance
The Pearson correlation of r = -0.41 indicates a moderate negative association, but the explanatory power is modest at best: R² = 0.169, meaning only 16.9% of the variance in software developer job postings is explained by semiconductor production levels. The remaining ~83% of variance is attributable to other factors entirely. The 95% confidence interval for r spans [-0.58, -0.20], which is meaningfully wide — reflecting real uncertainty about the true population-level effect, even though the p-value of 0.0002 confirms this is unlikely to be a chance finding at the sampled scale. Critically, the Granger causality test supports a unidirectional temporal relationship: semiconductor production (X) Granger-causes software developer job postings (Y) at an optimal lag of 10 periods (F = 2.10, p = 0.044), while the reverse direction is not significant (F = 0.82, p = 0.61). This implies that changes in semiconductor output precede and may help predict shifts in software hiring demand, consistent with supply chain and hardware-software investment cycles, though Granger causality does not establish true causal mechanism.
3. Notable Patterns, Clusters, and Outliers
Several structural features warrant attention:
- Left cluster (X ≈ 62–100): A dense concentration of points exhibits dramatically high variance in Y (ranging from ~107 to ~188), including notable high-Y outliers such as (72.14, 188.01), (72.52, 183.61), (70.57, 178.57), and (66.56, 170.54). These likely represent early pandemic-period observations (2020–2021) when semiconductor production was suppressed but software hiring spiked due to the digital transformation surge. - Right cluster (X ≈ 130–235): Points here cluster tightly in the Y = 117–135 range, suggesting that at higher levels of semiconductor production, software job postings stabilize at a lower plateau — possibly reflecting post-pandemic normalization and hiring retrenchment in tech (2022–2024 layoff cycles). - The Spearman ρ exceeding Pearson r is a diagnostic flag that the true relationship is non-linear, likely logarithmic or step-function in nature, which is visually consistent with the apparent plateau behavior at higher X values. A polynomial or logarithmic fit would likely outperform the linear model.
4. Confounding Factors and Interpretive Caveats
Several important caveats apply:
- Time confounding is substantial. Both series are indexed to February 2020, and the period 2020–2026 contains extraordinary structural breaks: the COVID-19 pandemic, the global semiconductor shortage (2021–2022), aggressive Fed rate hikes (2022–2023), and AI-driven labor market restructuring (2023–2025). These macro shocks likely drive both series independently, generating spurious or context-specific correlation. - Axis labeling appears swapped in the dataset description — the X-axis column header references semiconductor production but is labeled as originating from the Indeed job postings dataset, and vice versa. This metadata inconsistency should be verified before drawing firm conclusions. - Ecological inference risk: The N = 653 population-level observations are sampled down to n = 76 monthly data points, which may not represent the full distributional range uniformly across time. - The 10-period Granger lag is substantial and may reflect the long lead times in semiconductor capital investment cycles rather than a direct operational linkage to software hiring decisions.
5. Actionable Insights and Further Investigation
Practical takeaway: Semiconductor production levels appear to be a lagged leading indicator of software developer hiring activity, with production increases preceding hiring slowdowns by approximately 10 months. This could be strategically useful for workforce planning in tech firms and for policymakers monitoring labor market tightening.
Recommended next steps: - Fit a non-linear model (logarithmic or piecewise linear) to better capture the apparent threshold behavior, particularly the high-variance regime at low X values. - Segment the time series into pre/post-2022 periods to test whether the negative correlation is consistent across cycles or driven entirely by the 2020–2021 pandemic anomaly. - Introduce control variables such as Fed funds rate, broad tech sector revenue, or AI investment indices to partial out macroeconomic confounding. - Verify the 10-period lag interpretation — whether it corresponds to months or another frequency unit — as this materially affects the practical forecasting horizon. - Cross-validate with other hiring indices (e.g., Burning Glass, LinkedIn) to confirm whether the Indeed index is representative or subject to platform-specific trends.
X dataset: FRED: IT Software Developer Job Postings Index on Indeed (IHLIDXUSTPSOFTDEVE)
Y dataset: FRED: Industrial Production: Semiconductor and Other Electronic Component Manufacturing
Part of experiment: FRED Indeed - FRED: IT Software Developer Job Postings Index on Indeed (IHLIDXUSTPSOFTDEVE) vs FRED: Industrial Production: Semiconductor and Other Electronic Component Manufacturing