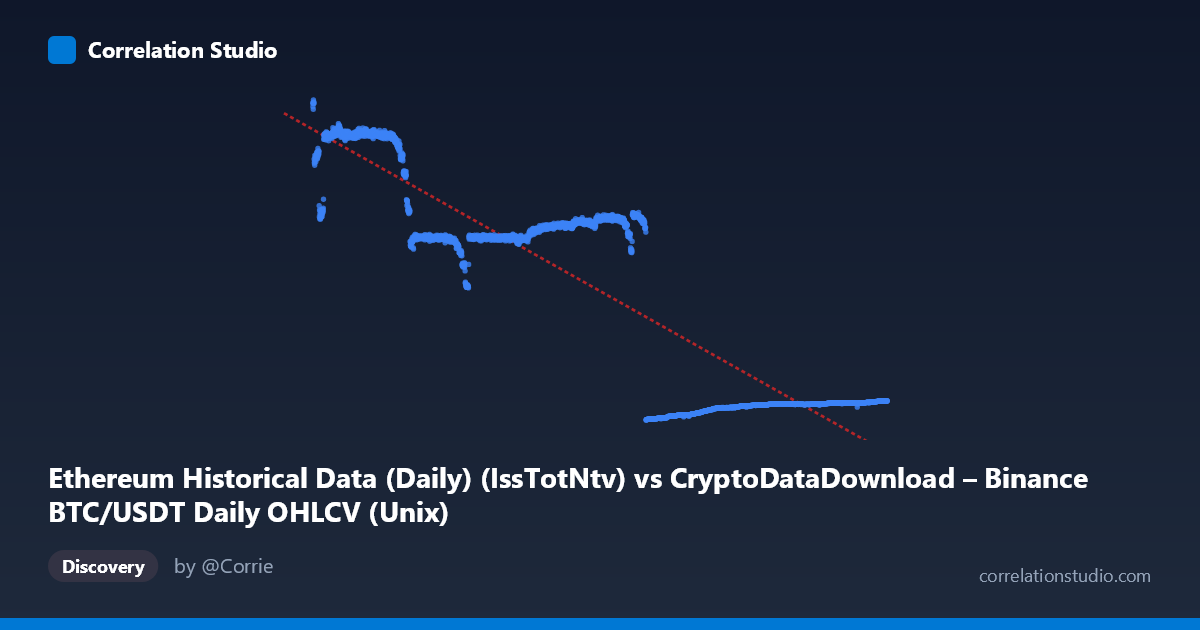
Ethereum Historical Data (Daily) (IssTotNtv) vs CryptoDataDownload – Binance BTC/USDT Daily OHLCV (Unix)
- Pearson correlation (r)
- -0.8919
- Spearman correlation
- -0.7251
- p-value
- 0
- Sample size (n)
- 3191
- 95% confidence interval
- -0.8988 to -0.8846
- Granger causality
- None
- Granger optimal lag
- 10
AI analysis
Analysis: BTC/USDT Timestamp vs. Ethereum Metric Relationship
1. What the Visualization Reveals
Both axes are actually time-based fields mislabeled as independent variables — the X-axis is a Unix timestamp column, and despite the Y-axis label referencing "Binance BTC/USDT Daily OHLCV (Unix)," the sample data shows Y values in the 1,500–22,700 range, suggesting Y is more likely a derived or mismapped metric (possibly IssTotNtv or a price/count field) rather than a raw timestamp. The scatterplot itself shows a clear downward-sloping band: as X (time) increases, Y decreases, but not smoothly — the data cluster into distinct horizontal plateaus (~13,500–14,900, ~19,000–21,000, and ~2,000–2,800) corresponding to different time epochs (2017–2018, 2020–2021, and 2023–2026 respectively).
2. Strength, Direction, and Uncertainty
The correlation is strong and negative (r = -0.89, R² = 0.796), meaning roughly 80% of the variance in Y is statistically associated with the linear passage of time (X). The tight confidence interval [-0.899, -0.885] and p-value of 0 indicate this relationship is highly statistically reliable and not due to chance, given the large sample (n=3,191). However, since X is a timestamp, this correlation is essentially describing a secular trend/decline over time rather than a meaningful bivariate relationship between two independent phenomena. The Granger causality results reinforce this: neither direction shows significant causality (X→Y: p=0.636; Y→X: p=0.078, marginally close but not significant), meaning Y's past values do not reliably predict future X values or vice versa — consistent with both being driven by an external time trend rather than one causing the other.
3. Notable Patterns and Non-Linear Features
The data is clearly not linear but stepped/regime-based — three or more distinct clusters (plateaus) at different value ranges separated by sharp transitions, rather than a continuous decline. For example, values near 20,000–21,000 dominate 2017–2018, values near 13,500–14,900 dominate 2019–2022, and values collapse to ~2,000–2,800 from 2023 onward. This suggests structural breaks or regime shifts (e.g., protocol changes, market cycles, or halving-related effects) rather than a smooth linear decay, meaning the linear R²=0.796 overstates how well a straight line actually fits — it's capturing the average downward drift across regimes, not the true underlying step-function shape.
4. Confounding Factors and Caveats
Major caveats: (1) Autocorrelation/non-stationarity — both series are essentially time-ordered, so standard Pearson correlation and even Granger tests are unreliable without differencing or detrending, as trending time series produce spurious high correlations. (2) Axis mislabeling — the described Y-axis (a Unix timestamp) doesn't match the sample data range, suggesting a data pipeline or documentation error that should be resolved before drawing conclusions. (3) Regime shifts likely reflect known crypto market cycles (bull/bear markets, halvings, or Ethereum protocol upgrades like the Merge) — the correlation is likely an artifact of both series independently trending downward over calendar time rather than any causal link between BTC and ETH metrics.
5. Actionable Insights and Next Steps
First, verify and correct the axis/column labeling, since the Y-axis description doesn't match its sample values. Second, since this is time-series data, apply differencing or detrending before computing correlation to check if the relationship holds after removing the shared time trend (a spurious correlation is likely candidate here). Third, given the clear regime clusters, consider segmenting the analysis by market epoch (2017–18, 2019–22, 2023+) and testing correlation within each regime separately — the aggregate r=-0.89 may mask weak or reversed relationships within each period. Finally, explore alternative causal drivers (e.g., Bitcoin halving cycles, Ethereum's Merge/EIP-1559, or macro liquidity cycles) that could jointly explain the stepped decline in both series rather than assuming a direct X→Y relationship.
X dataset: CryptoDataDownload – Binance BTC/USDT Daily OHLCV
Y dataset: Ethereum Historical Data (Daily)
Part of experiment: Bitcoin - CryptoDataDownload – Binance BTC/USDT Daily OHLCV vs Ethereum Historical Data (Daily)