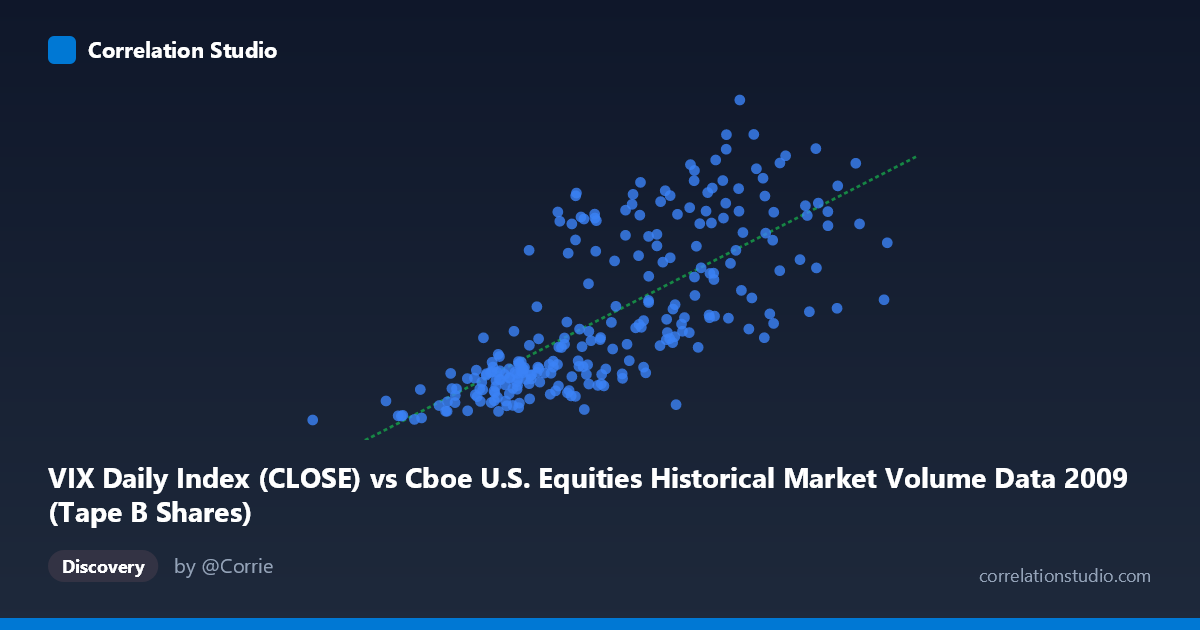
VIX Daily Index (CLOSE) vs Cboe U.S. Equities Historical Market Volume Data 2009 (Tape B Shares)
- Pearson correlation (r)
- 0.7295
- Spearman correlation
- 0.789
- p-value
- 0
- Sample size (n)
- 252
- 95% confidence interval
- 0.666 to 0.7825
- Granger causality
- None
- Granger optimal lag
- 1
AI analysis
Scatterplot Analysis: VIX Daily Index vs. Tape B Shares (2009)
Relationship Overview
The scatterplot reveals a moderately strong positive relationship between the VIX Daily Index (close) and Cboe U.S. Equities Tape B Shares volume in 2009. As VIX values increase — reflecting higher market volatility and fear — Tape B share volume tends to rise correspondingly. This directional alignment is intuitive: periods of elevated market uncertainty historically drive surges in trading activity as investors reposition, hedge, or liquidate holdings. The linear regression equation (y = 1.55×10⁻⁷x + 8.748) confirms a positive slope, and the scatter of points generally follows this upward trend across the observed range of approximately 33.8M to 255.8M on the X-axis and 19.47 to 56.65 on the Y-axis.
Correlation Strength and Statistical Significance
The Pearson correlation of r = 0.7295 indicates a moderately strong positive association, and the r² of 0.5322 means that roughly 53.2% of the variance in Tape B Shares is explained by VIX levels — a meaningful but incomplete explanatory relationship. The remaining ~47% of variance is attributable to other factors not captured here. The 95% confidence interval for r falls between [0.660, 0.783], a relatively tight band given the sample of 252 paired observations drawn from a population of 3,232, lending considerable statistical confidence to the estimate. The p-value of effectively zero confirms this correlation is highly unlikely to be a chance artifact. However, the Granger causality results are striking in their nullity: neither direction (X→Y: F=0.077, p=0.781; Y→X: F=0.025, p=0.876) shows statistically significant temporal predictive power at lag 1. This means that while the two variables co-move strongly in level terms, neither reliably predicts the other's next-day movement — a critical caveat for any trading or forecasting application.
Notable Patterns, Clusters, and Outliers
The data exhibits several visually distinct features. A dense cluster of points occupies the lower-left region (X: 80M–160M, Y: 19–32), corresponding to calmer, lower-volatility trading days that dominated mid-to-late 2009 as markets stabilized post-crisis. A second, more dispersed cluster appears in the upper-right (X: 160M–255M, Y: 38–56), representing high-volatility, high-volume sessions likely concentrated in early 2009 during peak financial crisis stress. The spread in this upper cluster is noticeably wider, suggesting greater variability in the relationship at elevated VIX levels. A handful of potential outliers are visible — notably the lowest point near (33.8M, 19.47) and several points where high X values don't correspond proportionally to high Y values (e.g., ~254M, 33.44), hinting at days where volume was elevated for reasons other than volatility. The relationship also appears to carry a slight non-linear curvature, with the density of points suggesting a possible logarithmic or power-law fit might outperform the linear model at extremes.
Confounding Factors and Interpretation Caveats
Several important caveats temper interpretation. 2009 was an exceptional year — spanning the tail of the global financial crisis through the early stages of recovery — meaning the correlation may be heavily regime-driven and non-generalizable to other periods. The strong co-movement could reflect a common driver (e.g., macro economic shocks, Fed policy announcements, or earnings seasons) simultaneously lifting both VIX and volume, rather than a direct causal mechanism between them. Additionally, the axis labels appear swapped relative to convention: VIX is plotted on the X-axis while Tape B Shares appear on the Y-axis, which is somewhat counterintuitive given VIX is typically treated as the independent market condition variable. The absence of Granger causality also warns against assuming that VIX leads volume in a temporally exploitable way. Finally, Tape B specifically covers NYSE American and regional exchanges — a subset of total market volume — which may behave differently from aggregate market volume.
Actionable Insights and Further Investigation
Despite the lack of Granger causality, the strong contemporaneous correlation (r ≈ 0.73) suggests that VIX can serve as a reliable same-day proxy or indicator for Tape B trading activity, useful for capacity planning, liquidity estimation, or risk exposure modeling. Practitioners should investigate extended lag structures (beyond lag 1) to determine whether predictive relationships emerge over multi-day windows. Regime segmentation — separately analyzing the crisis period (Q1 2009) versus the recovery period (Q3–Q4 2009) — would clarify whether the correlation is stable or artifact of crisis dynamics. Testing non-linear models (logarithmic, polynomial) against the linear fit could improve predictive accuracy given the apparent curvature. Finally, incorporating additional covariates such as S&P 500 returns, bid-ask spreads, or options open interest into a multivariate model would help disentangle the residual 47% unexplained variance and identify whether the VIX–volume relationship is truly direct or primarily mediated by broader market stress indicators.
X dataset: Cboe U.S. Equities Historical Market Volume Data 2009
Y dataset: VIX Daily Index
Part of experiment: Daily - Cboe U.S. Equities Historical Market Volume Data 2009 vs VIX Daily Index