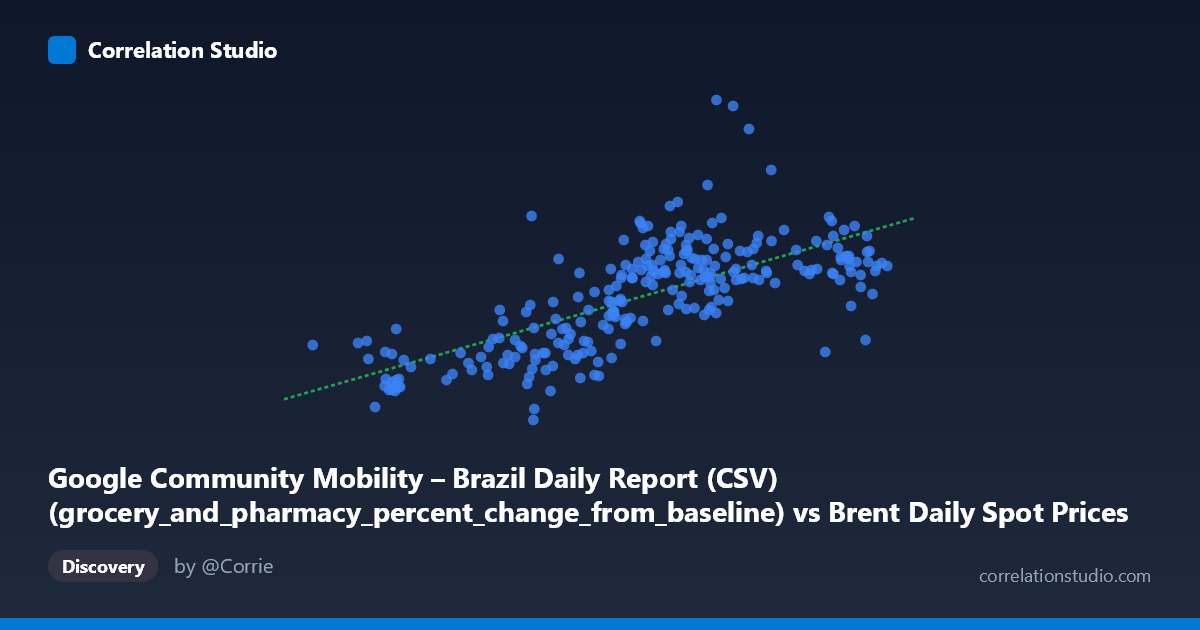
Google Community Mobility – Brazil Daily Report (CSV) (grocery_and_pharmacy_percent_change_from_baseline) vs Brent Daily Spot Prices (Price)
- Pearson correlation (r)
- 0.6967
- Spearman correlation
- 0.7242
- p-value
- 0
- Sample size (n)
- 253
- 95% confidence interval
- 0.6272 to 0.7551
- Granger causality
- None
- Granger optimal lag
- 1
AI analysis
Analysis: Brazil Grocery/Pharmacy Mobility vs. Brent Crude Oil Prices (2021)
1. Overview of the Visualization The scatterplot reveals a moderate positive relationship between Google Community Mobility changes at grocery and pharmacy locations in Brazil and daily Brent crude oil spot prices across 2021. As mobility at essential retail venues increases above baseline, Brent prices tend to rise as well. The linear regression (y = 1.554x − 70.30) slopes upward meaningfully, and the point cloud, while moderately dispersed, shows a discernible upward trend across the X range of roughly 50–86 percent change from baseline. The spread widens noticeably at higher mobility values, suggesting heteroscedasticity — the relationship becomes less predictable as mobility increases.
2. Correlation Strength, Direction, and Temporal Predictability The Pearson correlation of r = 0.697 indicates a moderate-to-strong positive association, though the R² of 0.485 means that only about 48.5% of the variance in Brent prices is explained by Brazilian grocery/pharmacy mobility. That leaves roughly half the variance unaccounted for by this single predictor alone. The 95% confidence interval of [0.627, 0.755] is relatively tight and well above zero, and the p-value ≈ 0 (with n = 253 from a population of 1,095) confirms the relationship is highly statistically significant and not a sampling artifact. However, the Granger causality tests are critical here: neither direction (X→Y: F = 1.25, p = 0.265; Y→X: F = 0.11, p = 0.743) reaches significance, meaning neither variable reliably predicts the other temporally at a 1-period lag. This firmly suggests the correlation is contemporaneous and likely driven by a shared underlying factor rather than any direct causal mechanism in either direction.
3. Notable Patterns, Clusters, and Outliers Several structural features stand out in the data. There is a visible lower-left cluster around X = 50–65 with low Brent prices (Y ≈ 0–25), consistent with the early-2021 period when both mobility restrictions and oil prices were depressed. The bulk of observations form a central cloud between X = 68–80 and Y = 30–65, representing the more stable mid-year period. One prominent outlier appears at approximately (75.24, 105.00), where Brent price reaches its dataset maximum of $105/barrel — well above the regression line at that X value and likely representing a specific geopolitical or supply-shock event. A few points near X = 64–65 with very low Y values (Y ≈ 2–12) also sit far below the trend, potentially corresponding to pandemic-related oil demand collapses coinciding with mobility rebounds. The heteroscedasticity noted in the upper range suggests the linear model may underfit complexity at higher mobility levels.
4. Confounding Factors and Interpretive Caveats The most important caveat is that this correlation almost certainly reflects a common temporal driver rather than any meaningful causal link between Brazilian retail mobility and global oil prices. Both variables trend upward through 2021 as COVID-19 restrictions eased globally — mobility recovered as vaccination rolled out, and oil prices recovered in tandem with global economic reopening. This creates a spurious time-trend confound: two independently recovering time series will appear correlated even without any real connection. Additionally, Brent crude is a global benchmark primarily driven by OPEC+ decisions, geopolitical events, and international demand, making it structurally disconnected from Brazilian domestic mobility patterns. The dataset note also highlights a dataset labeling swap (each dataset's column appears in the other's description), which warrants verification of data alignment before drawing any conclusions.
5. Actionable Insights and Further Investigation Given the lack of Granger causality and the strong prior reason to suspect a shared time trend, the most productive next step would be to detrend both series (e.g., first-differencing or seasonal decomposition) and retest the correlation on the residuals — this would reveal whether any relationship persists beyond the common 2021 recovery trajectory. Researchers should also include additional covariates such as global PMI indices, OPEC production announcements, or Brazil's vaccination rate to disentangle the common drivers. Extending the lag window in Granger testing beyond one period could also be informative. Finally, comparing this pattern against other country-level mobility datasets (e.g., US, EU) would test whether the correlation is specific to Brazil or simply reflects a global synchrony between post-pandemic reopening and oil price recovery — which would strongly support the spurious confounding hypothesis.
X dataset: Brent Daily Spot Prices
Y dataset: Google Community Mobility – Brazil Daily Report (CSV)
Part of experiment: Daily - Brent Daily Spot Prices vs Google Community Mobility – Brazil Daily Report (CSV)