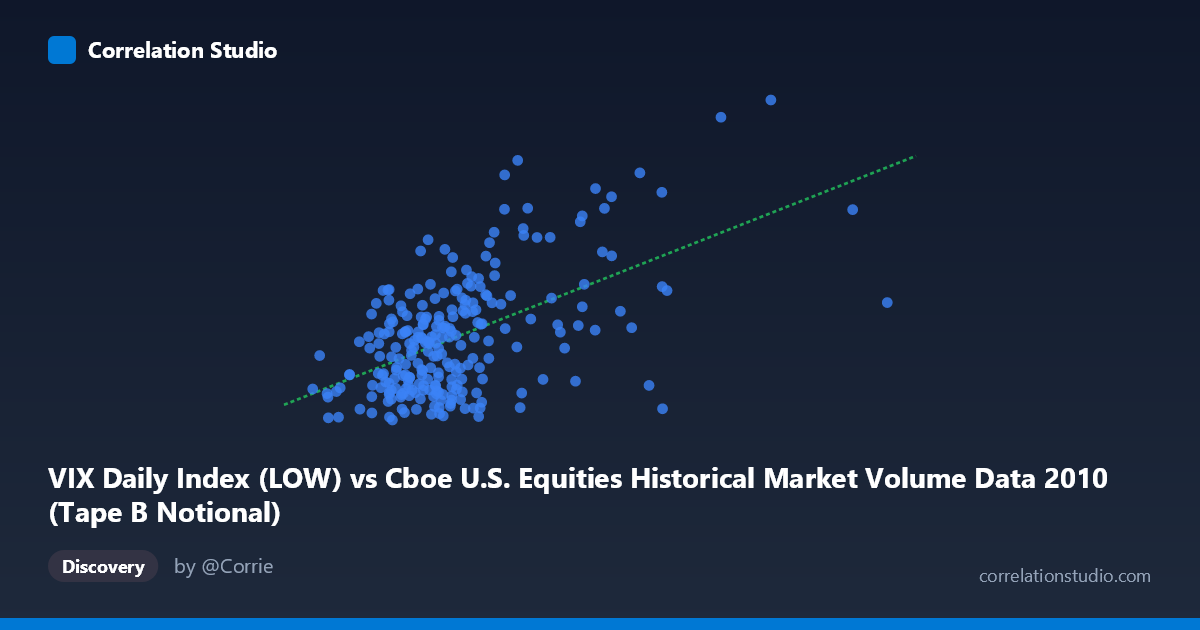
VIX Daily Index (LOW) vs Cboe U.S. Equities Historical Market Volume Data 2010 (Tape B Notional)
- Pearson correlation (r)
- 0.5429
- Spearman correlation
- 0.4381
- p-value
- 0
- Sample size (n)
- 252
- 95% confidence interval
- 0.4495 to 0.6246
- Granger causality
- Y → X
- Granger optimal lag
- 1
AI analysis
Scatterplot Analysis: VIX Tape B Notional vs. VIX Daily Index Low
Relationship Overview
The scatterplot reveals a moderate positive relationship between the Cboe U.S. Equities Historical Market Volume (VIX Daily Index Low, X-axis) and the VIX Tape B Notional values (Y-axis) across 252 trading days in 2010. As market volume increases, VIX-related notional values tend to rise as well, which is intuitively consistent with the well-established link between market volatility and trading activity. The linear regression equation (y = 1.235×10⁻⁹x + 15.31) suggests a very shallow slope given the enormous scale of X values (ranging into the tens of billions), with a baseline VIX notional around 15.3 even at minimal volume levels — roughly corresponding to the lower bound of realized VIX readings during this relatively calm post-crisis year.
Correlation Strength and Statistical Significance
The Pearson correlation of r = 0.543 indicates a moderate positive association, but the explanatory power is notably limited: R² = 0.295, meaning only about 29.5% of the variance in Tape B Notional is accounted for by the VIX Low index. The remaining ~70.5% of variability is driven by factors this bivariate model does not capture. The 95% confidence interval for r of [0.450, 0.625] is reasonably tight, reflecting the relatively large paired sample (n = 252), and the p-value of effectively zero confirms the relationship is highly unlikely to be a statistical artifact. Critically, the Granger causality analysis points unidirectionally: Y Granger-causes X (F = 6.30, p = 0.013), while X does not Granger-cause Y (F = 2.07, p = 0.152). This means past VIX Tape B Notional values carry statistically meaningful predictive information about future market volume levels, but not vice versa — suggesting volatility sentiment leads volume, rather than volume driving sentiment in this data.
Notable Patterns, Clusters, and Outliers
The sample points reveal a distinct clustering of observations at lower X values (roughly 2–6 billion range) with Y values concentrated between 15 and 26, consistent with the baseline trading environment of early-to-mid 2010. However, several notable high-leverage outliers stand out: the point near (15.1B, 31.7) and (11.8B, 39.0) represent days of exceptionally high volume coinciding with elevated VIX readings — likely corresponding to the May 2010 Flash Crash and its aftermath, one of the most significant volatility events of the year. Similarly, (9.8B, 34.6) and (8.7B, 33.4) cluster in a high-volume, high-volatility region. These extreme observations are pulling the regression line upward and likely inflating the correlation estimate. The bulk of the distribution forms a relatively diffuse cloud with weak linear structure, suggesting the relationship may be driven disproportionately by a handful of stress events rather than a consistent day-to-day mechanism.
Confounding Factors and Interpretive Caveats
Several important caveats apply. First, the axis labeling appears to be transposed — the X-axis is labeled as "VIX Daily Index (LOW)" from a market volume dataset, while the Y-axis is labeled as "Tape B Notional" from the VIX dataset — which warrants verification of the data pipeline before drawing firm conclusions. Second, the 2010 timeframe is not representative of normal conditions: the Flash Crash of May 6, 2010 created an extreme, non-recurring shock that may be disproportionately driving the observed correlation. Third, Tape B Notional reflects trading activity specifically on NYSE American and regional exchanges, so it represents a subset of total market activity rather than a comprehensive volume measure. Finally, the Granger causality result, while statistically significant at a lag of 1 period, does not imply true economic causation — shared underlying drivers such as macroeconomic news releases, Federal Reserve announcements, or risk-off sentiment shifts likely co-move both variables simultaneously.
Actionable Insights and Further Investigation
Practitioners should explore whether the observed predictive relationship (Y→X) holds out-of-sample across other years, particularly in both high- and low-volatility regimes, to assess robustness. Removing or separately modeling the Flash Crash period would help distinguish whether the correlation reflects a genuine structural relationship or is largely an artifact of a single extreme event. Extending the Granger causality analysis to multiple lags and incorporating control variables (e.g., S&P 500 returns, bid-ask spreads, or aggregate market volume) would help isolate the independent contribution of VIX notional to volume prediction. Additionally, a non-linear model (e.g., log-log regression or spline fitting) may better capture the apparent threshold effect visible in the scatterplot, where the relationship seems to strengthen sharply during high-stress periods. Finally, repeating this analysis across multiple years would clarify whether the Granger-causal direction is stable or regime-dependent.
X dataset: Cboe U.S. Equities Historical Market Volume Data 2010
Y dataset: VIX Daily Index
Part of experiment: Daily - Cboe U.S. Equities Historical Market Volume Data 2010 vs VIX Daily Index