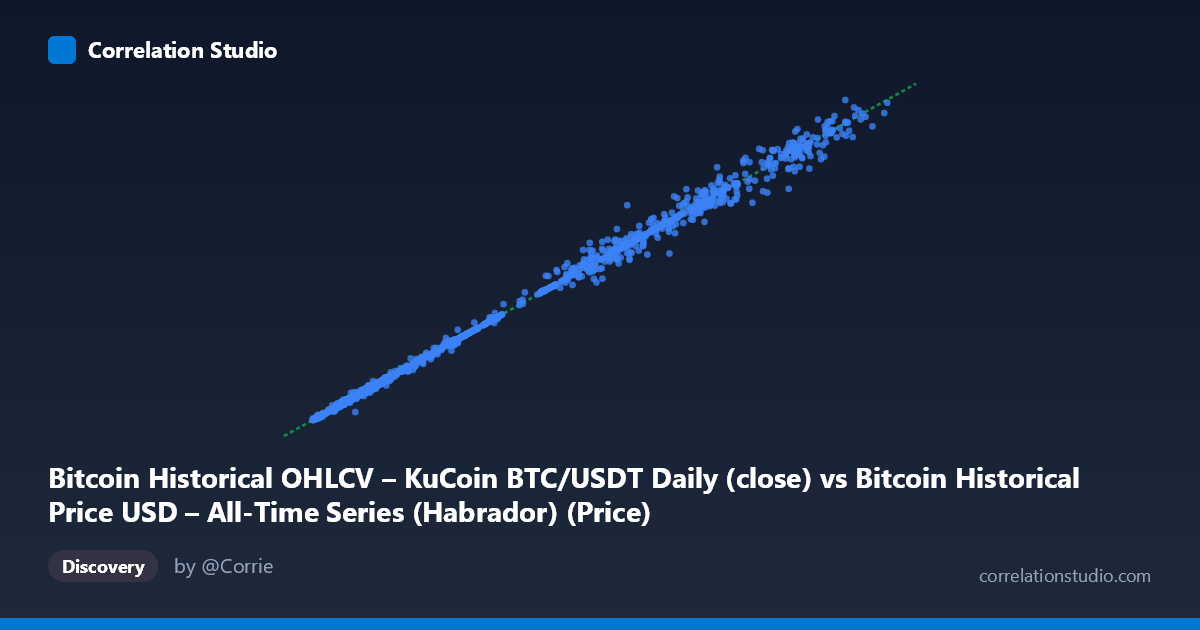
Bitcoin Historical OHLCV – KuCoin BTC/USDT Daily (close) vs Bitcoin Historical Price USD – All-Time Series (Habrador) (Price)
- Pearson correlation (r)
- 0.9985
- Spearman correlation
- 0.9987
- p-value
- 0
- Sample size (n)
- 1861
- 95% confidence interval
- 0.9984 to 0.9987
- Granger causality
- None
- Granger optimal lag
- 10
AI analysis
Analysis: Bitcoin Price Correlation Across Two Data Sources
1. What the Visualization Reveals
This scatterplot compares Bitcoin's closing price as recorded in two different historical datasets—one a general "all-time series" aggregation, the other sourced specifically from KuCoin's BTC/USDT daily candles. The plot shows points hugging an almost perfect diagonal line (slope ≈ 0.999, intercept ≈ 34.6), which is exactly what we'd expect if both columns are measuring the same underlying phenomenon (Bitcoin's daily closing price) from different vendors or aggregation methodologies, rather than two genuinely distinct variables.
2. Strength, Direction, and Practical Meaning
The correlation is about as strong as empirical data gets: r = 0.9985, r² = 0.9971. This means 99.71% of the variance in Y is explained by X, leaving less than 0.3% attributable to noise, discrepancies, or divergent data collection. The 95% CI [0.9984, 0.9987] is extremely tight given the large sample (n = 1,861 daily observations spanning Oct 2017–Nov 2022), and the p-value of 0 confirms this relationship is not a chance artifact. Practically, X is an almost perfect predictor of Y (and vice versa) — the regression line y ≈ 0.999x + 34.6 indicates near 1:1 parity with only a negligible constant offset. Importantly, the Granger causality test shows no significant predictive direction in either direction (X→Y: p=0.557; Y→X: p=0.564). This is a critical clue: true economic "causality" between two independent price series would often show at least weak lead-lag structure, especially at daily granularity. The absence of such structure supports the interpretation that these are not two causally linked markets but two records of the same event — the correlation is contemporaneous/definitional, not predictive.
3. Notable Patterns and Outliers
The scatter is tight and linear across nearly two orders of magnitude (~$3,200 to ~$67,600), with no visible regime breaks, curvature, or heteroskedasticity — the spread does not visibly widen at higher price levels, suggesting proportional (not additive) noise is minimal. A few sample rows show larger deviations (e.g., 51,503 vs. 54,868; 45,237 vs. 47,942; 56,609 vs. 53,794), representing gaps of $2,000–$3,000 during high-volatility periods (likely 2021 bull-market spikes). These divergences cluster at higher price levels and during known high-volatility Bitcoin episodes, implying that discrepancies between data sources grow (in absolute terms) during rapid price swings — possibly due to timestamp/timezone misalignment, differing close-time conventions, or exchange-specific price differences during fast-moving markets.
4. Confounding Factors and Caveats
The central caveat is that this is likely not two independent variables but two measurements of one variable (BTC/USD close) sourced differently — one general historical aggregator, one specifically KuCoin. Any "correlation" analysis here is measuring data consistency/reconciliation quality, not an economic relationship. Confounds include: exchange-specific price variance (KuCoin vs. a blended/aggregate index), timestamp/day-boundary mismatches across time zones, missing-data interpolation methods, and differing treatment of illiquid or thin-volume periods. The Granger non-causality result reinforces this: real market-linked series (e.g., BTC vs. ETH) usually show at least marginal lead-lag; here the total absence of it suggests they're simultaneous records of one price process rather than two separately evolving series.
5. Recommendations for Further Investigation
Given r² 0.997, this pairing is better used as a data validation/reconciliation exercise than a predictive modeling exercise. Suggested next steps: (1) plot the residuals (Y−X) over time to isolate exactly when/why divergences occur — likely flash-crash or high-volume days; (2) check whether the largest deviations correspond to specific dates with known exchange outages, low liquidity, or reporting lags; (3) if the goal is genuine causal/predictive modeling, use two genuinely distinct assets or markets, since Granger tests on two versions of the same price series are structurally uninformative; and (4) consider using this analysis primarily to select the more reliable/complete of the two data sources for downstream Bitcoin price modeling, using the regression intercept/slope to harmonize them if both must be retained.
X dataset: Bitcoin Historical Price USD – All-Time Series (Habrador)
Y dataset: Bitcoin Historical OHLCV – KuCoin BTC/USDT Daily
Part of experiment: Bitcoin - Bitcoin Historical Price USD – All-Time Series (Habrador) vs Bitcoin Historical OHLCV – KuCoin BTC/USDT Daily