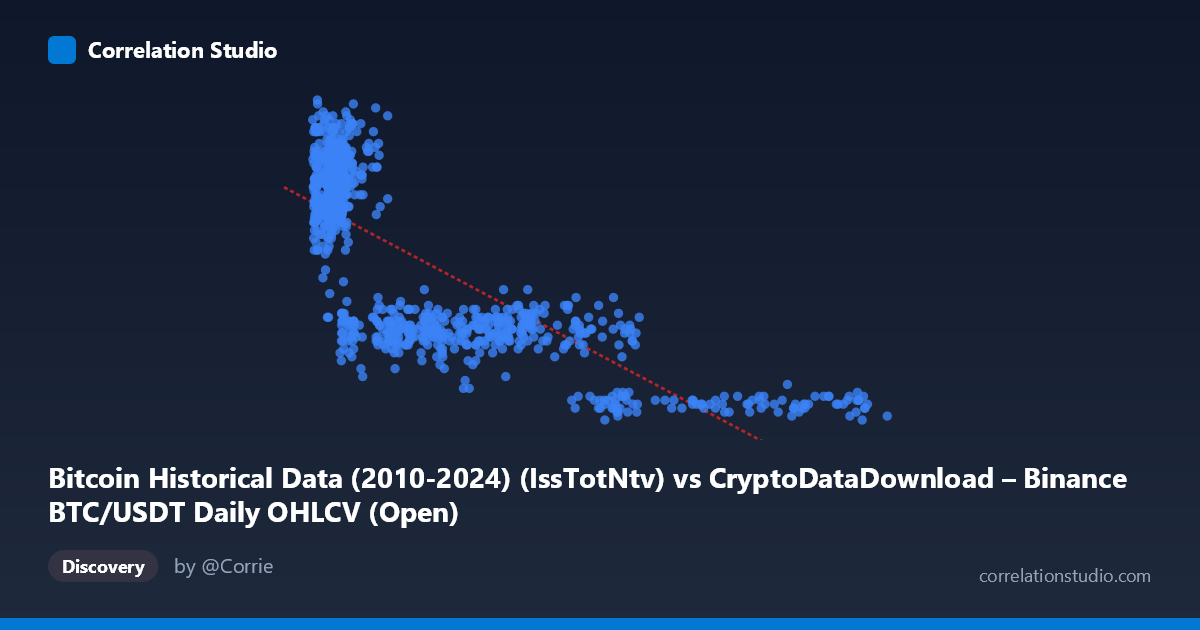
Bitcoin Historical Data (2010-2024) (IssTotNtv) vs CryptoDataDownload – Binance BTC/USDT Daily OHLCV (Open)
- Pearson correlation (r)
- -0.7758
- Spearman correlation
- -0.7607
- p-value
- 0
- Sample size (n)
- 938
- 95% confidence interval
- -0.8 to -0.7489
- Granger causality
- None
- Granger optimal lag
- 10
AI analysis
Analysis: Bitcoin Issuance (Native Units) vs. Opening Price
1. Relationship Overview
The scatterplot reveals a clear inverse, non-linear relationship between BTC issuance (native units, X) and BTC opening price (Y). At low issuance levels (~3,000–15,000), prices cluster in a high range (~1,600–2,375), showing considerable vertical spread. As issuance increases beyond ~30,000, prices drop sharply and compress into a narrow band (roughly 400–1,000), with very high issuance values (90,000) corresponding almost exclusively to prices below 500. The shape resembles a decaying curve (e.g., power-law or exponential decay) rather than a straight line, though the linear fit still captures a majority of the variance.
2. Strength, Direction, and Statistical Confidence
The Pearson correlation of r = -0.776 indicates a strong negative linear association, with r² = 0.602 meaning roughly 60% of the variance in opening price is statistically explained by issuance levels — a substantial but incomplete relationship, leaving ~40% driven by other factors. The 95% CI [-0.800, -0.749] is tight and does not cross zero, and the p-value of ~0 confirms this correlation is highly unlikely to be due to chance given n=938. However, the Granger causality tests show no significant predictive direction (X→Y: p=0.317; Y→X: p=0.723) at the optimal lag of 10 periods. This is a critical caveat: despite the strong contemporaneous correlation, neither variable helps forecast the other over time. This suggests the relationship is likely driven by a shared underlying trend (e.g., both are functions of time/market maturity) rather than one causing the other.
3. Notable Patterns and Outliers
The data shows at least two distinct regimes: a "high-price, low-issuance" cluster (X < 15,000, Y 1,600) and a "low-price, high-issuance" tail (X 60,000, Y < 1,000) with much lower variance. This bifurcated structure, rather than a smooth continuous cloud, suggests the relationship may reflect distinct market eras or halving-cycle effects rather than a stable functional relationship. Some outliers exist, such as (13,549, 875) and (19,832, 1,050), which fall on the boundary between regimes, and (114,958, 475) marking an extreme high-issuance/low-price point. The curvature suggests a log-linear or inverse relationship might fit better than the current linear model.
4. Confounding Factors and Caveats
The most significant confound is time: both variables likely trend systematically over the 2017–2026 window (issuance mechanically increases as more BTC enters circulation post-halvings, while price reflects broader market cycles unrelated to issuance mechanics). This shared time-trend can produce strong spurious correlation without direct causality — consistent with the Granger test finding no predictive power. Additionally, "IssTotNtv" (total native issuance) is a cumulative/monotonic metric, while price is highly volatile and cyclical (bull/bear markets), so pairing a monotonic X with a cyclical Y over-restricts the interpretation — a single correlation coefficient may mask regime-dependent relationships (e.g., correlation may be stronger or weaker in different halving epochs).
5. Actionable Insights
Analysts should avoid interpreting this correlation causally — the lack of Granger causality strongly implies both series are being driven by an omitted third variable (likely calendar time or halving schedule) rather than one directly influencing the other. For deeper insight: (1) detrend both series (e.g., using year-over-year changes or first differences) and re-test correlation/Granger causality to isolate any genuine short-term relationship; (2) segment the analysis by halving epoch, since issuance rate drops discretely at halvings, to see if the relationship holds within regimes; and (3) fit a non-linear model (log or power transform on X) given the visible curvature, which may improve explanatory power beyond the current 60.2% R².
X dataset: CryptoDataDownload – Binance BTC/USDT Daily OHLCV
Y dataset: Bitcoin Historical Data (2010-2024)
Part of experiment: Bitcoin - CryptoDataDownload – Binance BTC/USDT Daily OHLCV vs Bitcoin Historical Data (2010-2024)