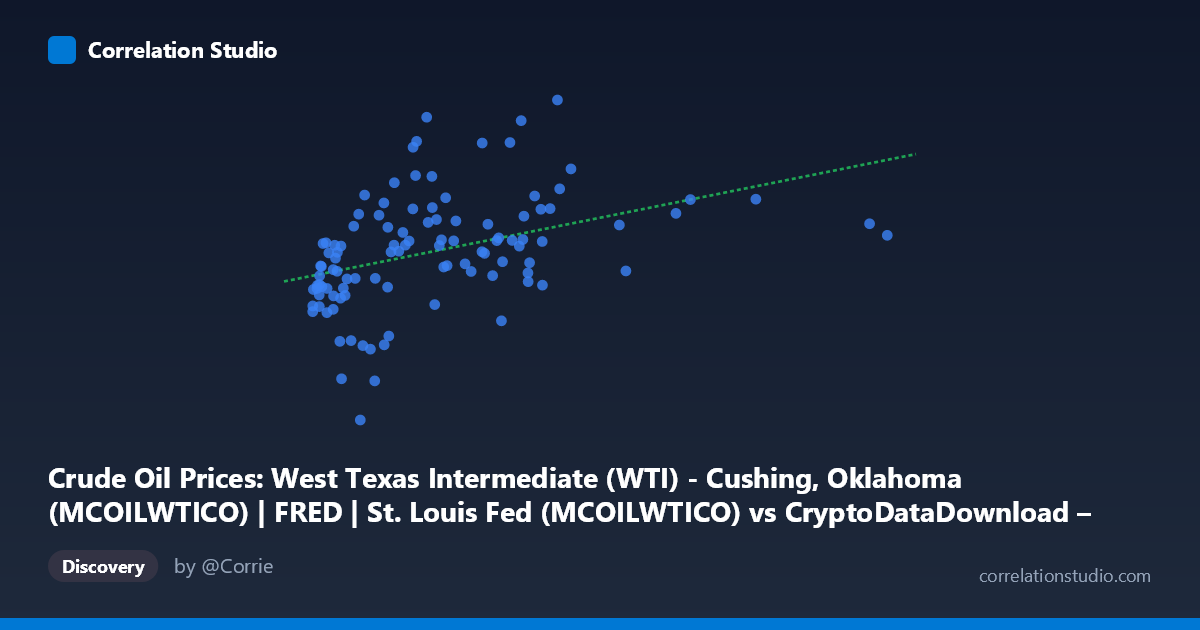
Crude Oil Prices: West Texas Intermediate (WTI) - Cushing, Oklahoma (MCOILWTICO) | FRED | St. Louis Fed (MCOILWTICO) vs CryptoDataDownload – Binance BTC/USDT Daily OHLCV (Volume USDT)
- Pearson correlation (r)
- 0.403
- Spearman correlation
- 0.5426
- p-value
- 0.000018
- Sample size (n)
- 106
- 95% confidence interval
- 0.2299 to 0.5513
- Granger causality
- None
- Granger optimal lag
- 5
AI analysis
Analysis: BTC/USDT Volume vs. WTI Crude Oil Prices
1. What the Visualization Reveals
The scatterplot shows a modest positive association between BTC/USDT trading volume (X-axis, mislabeled in the metadata but functionally the independent variable) and WTI crude oil prices (Y-axis). Points are widely scattered across the X range, which spans over three orders of magnitude (from ~2.7M to ~7.4B), while Y values cluster more tightly between roughly 17 and 115. The bulk of observations sit in the lower-to-mid X range (under ~2.5B), with a sparser tail of high-volume days extending toward the upper bound. Visually, there's a loose upward drift in oil prices as volume increases, but with substantial vertical scatter at every X level, indicating volume alone is a weak predictor of price on any given day.
2. Strength, Direction, and Statistical Confidence
The Pearson correlation (r = 0.403) indicates a weak-to-moderate positive relationship, with r² = 0.162 meaning only about 16% of the variance in oil prices is explained by trading volume — the remaining 84% is driven by other factors entirely. The 95% CI [0.230, 0.551] is reasonably tight and excludes zero, and the p-value (1.85E-05) is highly significant, so we can be confident a real, non-zero linear association exists — but its practical magnitude is limited. Critically, the Granger causality tests show no significant predictive direction in either direction (X→Y: p=0.083; Y→X: p=0.394). This means neither variable reliably forecasts future movements in the other at the tested lag structure (5 periods), suggesting the correlation is likely coincidental co-movement (e.g., both trending upward over 2017–2026) rather than a causal or leading/lagging relationship.
3. Notable Patterns and Features
Several data points stand out: very high-volume observations (e.g., ~7.44B, ~5.74B, ~4.89B) don't show proportionally higher oil prices, with values in the 73–84 range similar to many mid-range X points — this flattening suggests diminishing returns or a plateau at high volume, consistent with the note that Spearman ρ exceeds Pearson r (implying a logarithmic or saturating relationship fits better than a straight line). There are also low-Y outliers at moderate X (e.g., 618M→16.55, the dataset minimum) that don't fit the general trend, and some low-X/high-Y points (e.g., 1.48B→109.55) suggesting price spikes unrelated to volume. Given X spans billions while Y spans only tens, a log-transform of X would likely linearize the relationship and improve fit.
4. Confounding Factors and Caveats
The most important caveat is that both series are independently trending over the 2017–2026 window — BTC volume has grown secularly with crypto market maturation, while oil prices have fluctuated due to unrelated macro shocks (COVID-19, the 2022 energy crisis, OPEC+ decisions). Any two non-stationary time series with upward or cyclical trends can show spurious correlation without genuine linkage. Additionally, this is a paired sample (n=106) drawn from a larger population (N=486), so sampling choices (every-2nd-point selection) could introduce artifacts. No lagged/differenced analysis was shown for the correlation itself (only for Granger causality), so the reported r may partly reflect trend-matching rather than genuine co-movement.
5. Suggestions for Further Investigation
Given the weak explanatory power and lack of Granger causality, this relationship should not be used for predictive trading or forecasting purposes as-is. Recommended next steps: (1) detrend or difference both series (e.g., use daily returns/changes instead of levels) to test for spurious correlation; (2) apply a log or square-root transform to X given its extreme skew and the Spearman/Pearson divergence, then re-run regression; (3) test for a structural break or regime dependence — the relationship may differ across bull/bear crypto cycles or oil price shocks; (4) explore common macro drivers (USD strength, inflation, risk-on/risk-off sentiment) that could jointly explain both series rather than assuming direct linkage between crypto volume and oil prices.
X dataset: CryptoDataDownload – Binance BTC/USDT Daily OHLCV
Y dataset: Crude Oil Prices: West Texas Intermediate (WTI) - Cushing, Oklahoma (MCOILWTICO) | FRED | St. Louis Fed
Part of experiment: Bitcoin - CryptoDataDownload – Binance BTC/USDT Daily OHLCV vs Crude Oil Prices: West Texas Intermediate (WTI) - Cushing, Oklahoma (MCOILWTICO) | FRED | St. Louis Fed