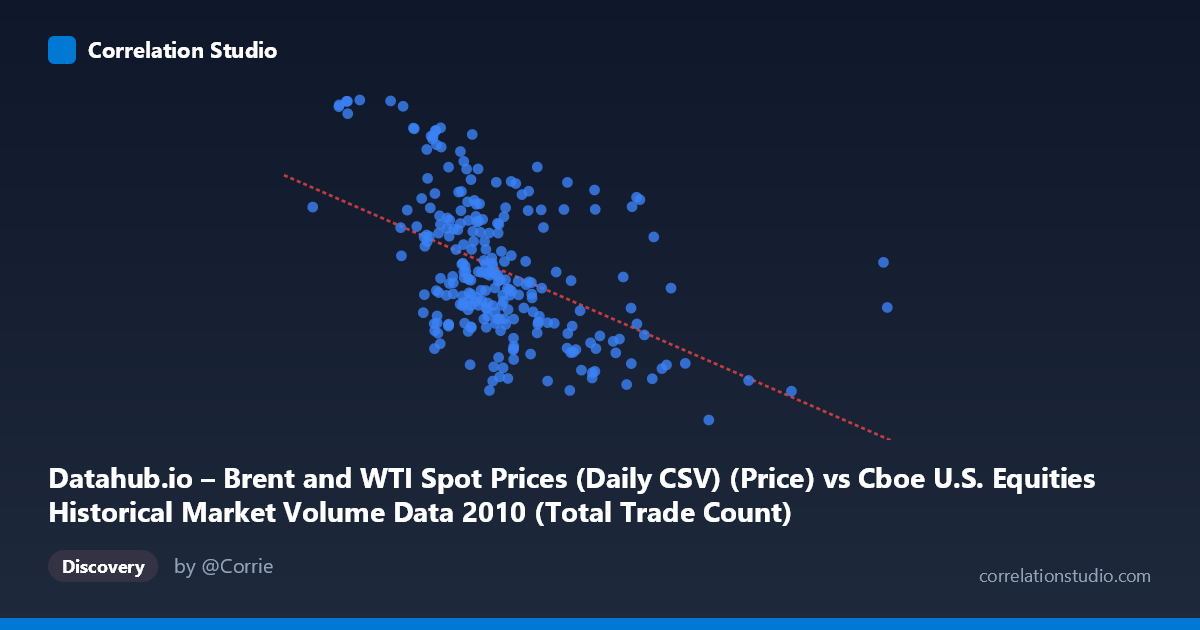
Datahub.io – Brent and WTI Spot Prices (Daily CSV) (Price) vs Cboe U.S. Equities Historical Market Volume Data 2010 (Total Trade Count)
- Pearson correlation (r)
- -0.484
- Spearman correlation
- -0.4855
- p-value
- 0
- Sample size (n)
- 252
- 95% confidence interval
- -0.5733 to -0.3834
- Granger causality
- None
- Granger optimal lag
- 1
AI analysis
Scatterplot Analysis: Oil Prices vs. U.S. Equity Market Trade Counts (2010)
Relationship Overview
The scatterplot reveals a moderate negative relationship between Brent/WTI crude oil spot prices (X-axis) and total trade counts on U.S. equity exchanges (Y-axis) across daily observations throughout 2010. As oil prices rise, equity market trade counts tend to decline, and vice versa. The linear regression equation (y = -4.27×10⁻⁶x + 89.15) captures this downward slope, though the scatter around the regression line is substantial, indicating that oil price alone is far from a complete explanation of trading activity. The relationship is visually apparent but noisy, with considerable dispersion at most price levels.
Correlation Strength and Statistical Significance
The correlation coefficient of r = -0.484 indicates a moderate negative association. However, the coefficient of determination r² = 0.234 tells a more sobering story: oil prices explain only about 23.4% of the variance in equity trade counts, meaning roughly 76.6% of the variation remains unexplained by this single variable. The 95% confidence interval of [-0.573, -0.383] is comfortably negative and does not cross zero, and the p-value of 2.22×10⁻¹⁶ confirms the correlation is highly statistically significant given the population of N = 3,302 trading days. Critically, however, the Granger causality tests reveal no significant temporal predictive relationship in either direction — neither oil prices predicting future trade counts (F = 0.58, p = 0.447) nor trade counts predicting future oil prices (F = 3.62, p = 0.058) reaches conventional significance thresholds. This means that while the two variables are contemporaneously correlated, there is no evidence that one leads the other in time, which substantially limits any causal interpretation.
Notable Patterns, Clusters, and Outliers
Several features stand out in the data. There is a notable cluster of observations in the X range of approximately 1,700,000–2,500,000, corresponding to mid-range oil prices (roughly $75–$85/barrel), where trade counts spread widely — this dense central cluster drives much of the correlation signal. At higher oil price levels (X 3,500,000), trade counts consistently fall below ~77, suggesting a compressed, lower-activity regime at elevated prices. A handful of conspicuous high-Y outliers are visible, including points near (1,046,906, 93.63) and (1,308,179, 93.55), representing days with unusually high trade counts at relatively low oil prices — these may correspond to specific market events or volatility spikes. Conversely, the point near (4,002,972, 67.18) represents notably low trade activity at high oil prices. The distribution also appears somewhat heteroscedastic, with greater variance in trade counts at lower oil price levels than at higher ones.
Confounding Factors and Caveats
Several important caveats apply. First, 2010 was a distinctive year — markets were recovering from the 2008–09 financial crisis, and both oil prices and trading volumes were heavily influenced by macroeconomic recovery dynamics, the European sovereign debt crisis, and the Flash Crash of May 2010, all of which could independently affect both variables. Second, the axis labels appear to be swapped in the dataset descriptions (the X-axis column is labeled from a Cboe dataset while described as oil price, and vice versa), which warrants verification before drawing firm conclusions. Third, the relationship may be spuriously driven by a shared third factor — such as broad macroeconomic uncertainty, risk appetite, or algorithmic trading patterns — rather than any direct mechanism linking oil prices to trade counts. The high frequency nature of trade count data also means microstructure noise could obscure underlying trends.
Actionable Insights and Further Investigation
Despite the absence of Granger causality, the moderate contemporaneous correlation warrants further exploration. Analysts should control for known confounders such as the VIX volatility index, equity market returns (S&P 500), and broad economic indicators to isolate whether any genuine oil-equity trading relationship exists after adjustment. It would be valuable to segment the analysis by exchange or trading type (e.g., dark pools vs. lit venues) since aggregate trade counts may mask heterogeneous responses. Extending the analysis beyond 2010 to multiple years would test whether this correlation is stable or an artifact of that specific market environment. Finally, exploring non-linear models or regime-switching frameworks — given the apparent heteroscedasticity and clustering — might better characterize the relationship than a simple linear regression, and could reveal threshold effects at extreme oil price levels.
X dataset: Cboe U.S. Equities Historical Market Volume Data 2010
Y dataset: Datahub.io – Brent and WTI Spot Prices (Daily CSV)
Part of experiment: Daily - Cboe U.S. Equities Historical Market Volume Data 2010 vs Datahub.io – Brent and WTI Spot Prices (Daily CSV)