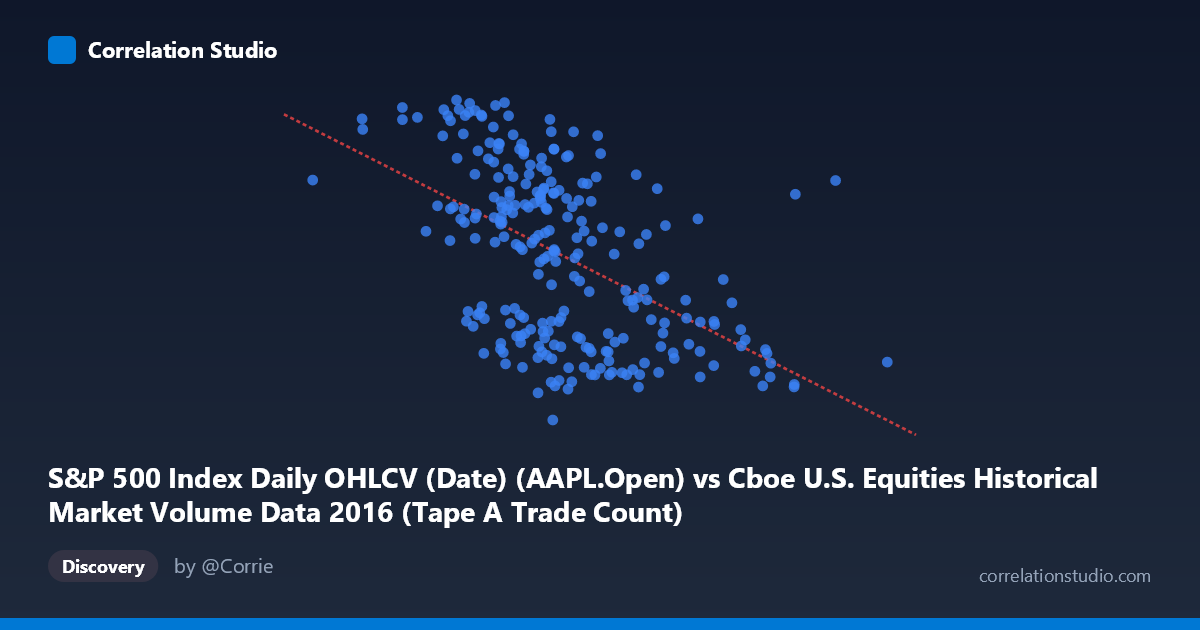
S&P 500 Index Daily OHLCV (Date) (AAPL.Open) vs Cboe U.S. Equities Historical Market Volume Data 2016 (Tape A Trade Count)
- Pearson correlation (r)
- -0.5138
- Spearman correlation
- -0.5331
- p-value
- 0
- Sample size (n)
- 252
- 95% confidence interval
- -0.5993 to -0.4167
- Granger causality
- None
- Granger optimal lag
- 1
AI analysis
Scatterplot Analysis: AAPL Opening Price vs. Cboe Tape A Trade Count (2016)
Relationship Overview The scatterplot reveals a moderate negative relationship between Apple's (AAPL) daily opening price on the S&P 500 and the Cboe U.S. Equities Tape A Trade Count throughout 2016. As AAPL's opening price increases, the number of Tape A trades tends to decrease. The linear regression equation (y = -1.31139E-05x + 122.722) reflects this downward slope, suggesting that higher AAPL valuations coincide with reduced trading activity on Tape A — an initially counterintuitive finding that warrants careful interpretation. The data spans the full 2016 calendar year across 252 paired observations drawn from a population of 506.
Correlation Strength and Statistical Significance The Pearson correlation coefficient of r = -0.5138 indicates a moderate negative association, but the explanatory power is more sobering: r² = 0.264 means only 26.4% of the variance in Tape A trade counts is explained by AAPL's opening price, leaving nearly three-quarters of the variation attributable to other factors. The 95% confidence interval of [-0.5993, -0.4167] is entirely negative and reasonably narrow, confirming that the negative direction is statistically reliable and not a chance artifact. The p-value of effectively zero confirms high statistical significance given the sample size. However, the Granger causality tests tell a critical story: neither direction (X→Y nor Y→X) achieves significance (F = 0.89, p = 0.35 and F = 0.99, p = 0.32, respectively), meaning that AAPL's opening price does not temporally predict future trade counts, nor do trade counts predict future AAPL prices. The correlation is contemporaneous but carries no directional predictive power at a one-period lag.
Patterns, Clusters, and Outliers The sample points reveal considerable vertical scatter at most X-axis values, consistent with the modest r². A notable concentration of observations clusters in the X range of roughly 1,100,000 to 1,500,000, corresponding to AAPL opening prices in the mid-to-upper trading range for the year, where Y values span nearly the full range (approximately 90–118). Several potential outliers are visible: points at lower X values (e.g., around 926,000–1,000,000) tend to exhibit higher-than-average trade counts (106–117), while points at higher X values (above 1,700,000–2,000,000) cluster toward lower trade counts (93–97). This pattern is consistent with the negative slope, but the spread at intermediate X values suggests substantial noise and possible non-linearity. The extreme right tail (X 1,800,000) shows a tighter cluster of low Y values, potentially indicating a threshold effect rather than a strictly linear decline.
Confounding Factors and Caveats Several important caveats apply. First, AAPL's opening price as a proxy for broader market conditions is a blunt instrument — Tape A trade counts reflect activity across all NYSE-listed equities, not just Apple. Any correlation may be driven by shared exposure to broader 2016 market events (e.g., Brexit volatility in June, post-election rally in Q4) rather than a direct economic link. Second, temporal autocorrelation is highly likely in both series, meaning individual data points are not fully independent, which can inflate the apparent statistical significance despite the low p-value. Third, the direction of the dataset labels appears swapped in the metadata (each column is listed under the opposing dataset's name), which could indicate a data joining or labeling issue that should be verified before drawing firm conclusions. Finally, seasonal trading rhythms and macroeconomic calendar effects could create spurious correlations within a single calendar year.
Actionable Insights and Further Investigation Given that Granger causality is absent, practitioners should avoid using AAPL price movements as a leading indicator for Tape A volume in trading strategies. Instead, the shared negative correlation likely reflects a common driver — such as market-wide risk appetite or volatility regimes — worth investigating directly (e.g., incorporating VIX data). Future analysis should consider: (1) extending the time series beyond 2016 to test whether this correlation is stable or year-specific; (2) adding control variables such as the CBOE VIX, overall S&P 500 index level, and days-to-earnings to partial out confounders; (3) testing non-linear models (e.g., polynomial or piecewise regression) given the visual clustering pattern; and (4) verifying dataset column alignment to ensure the join between the two source datasets is temporally accurate and label-correct before publishing or acting on these findings.
X dataset: Cboe U.S. Equities Historical Market Volume Data 2016
Y dataset: S&P 500 Index Daily OHLCV (Date)
Part of experiment: Daily - Cboe U.S. Equities Historical Market Volume Data 2016 vs S&P 500 Index Daily OHLCV (Date)