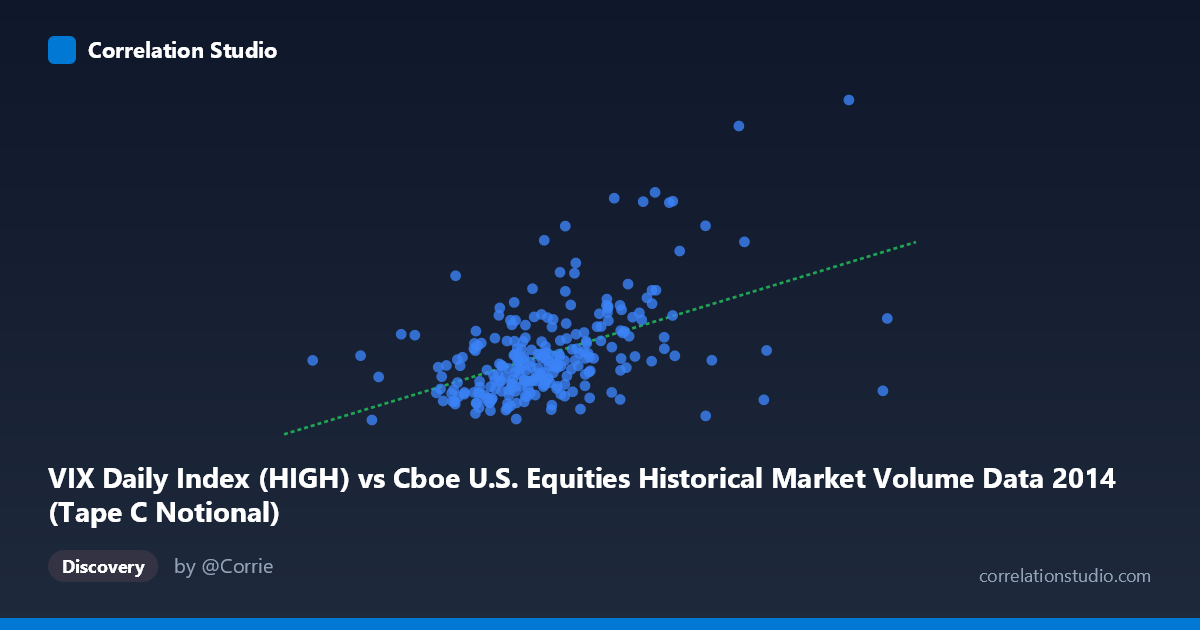
VIX Daily Index (HIGH) vs Cboe U.S. Equities Historical Market Volume Data 2014 (Tape C Notional)
- Pearson correlation (r)
- 0.4896
- Spearman correlation
- 0.4777
- p-value
- 0
- Sample size (n)
- 252
- 95% confidence interval
- 0.3896 to 0.5782
- Granger causality
- None
- Granger optimal lag
- 1
AI analysis
Scatterplot Analysis: VIX High vs. Tape C Notional Volume (2014)
Overall Relationship The scatterplot reveals a moderate positive relationship between the CBOE VIX Daily High Index and Tape C Notional trading volume across U.S. equities exchanges in 2014. As VIX high values increase, Tape C Notional volume tends to rise as well, consistent with the well-established market intuition that elevated volatility is accompanied by heavier trading activity. The linear regression equation (y = 1.575×10⁻⁹x + 7.318) captures this upward trend, though the scatter around the regression line is visibly substantial, signaling that the relationship is real but far from deterministic.
Correlation Strength and Statistical Significance The Pearson correlation of r = 0.4896 indicates a moderate positive association, but the explanatory power is more sobering: r² = 0.2397 means that VIX high values account for only ~24% of the variance in Tape C Notional volume, leaving roughly 76% unexplained by this linear relationship alone. The 95% confidence interval of [0.39, 0.58] is meaningfully above zero and relatively tight given n = 252, and the p-value of 2.22×10⁻¹⁶ confirms the correlation is extremely unlikely to be a statistical artifact. However, the Granger causality tests tell a more cautious story: neither direction (X→Y: F = 0.024, p = 0.878; Y→X: F = 0.013, p = 0.910) approaches significance, meaning neither variable temporally predicts the other at a one-period lag. This is an important caveat — statistical correlation does not imply that one series leads or drives the other in a predictive, time-ordered sense.
Notable Patterns, Clusters, and Outliers The data points are not uniformly dispersed across the scatterplot. A dense cluster is visible at lower VIX values (roughly 10–18) and moderate X-axis values (~4–5.5 billion), suggesting that during typical, low-volatility market days in 2014, Tape C Notional volume stayed within a relatively compressed range. However, several notable outliers at high VIX values (e.g., points near VIX ~29–31, such as (7.18B, 29.41) and (6.15B, 25.20)) pull the regression line upward and likely inflate the correlation coefficient. Conversely, some high-X observations show surprisingly low Y values (e.g., (6.77B, 11.02)), suggesting a non-trivial number of high-volume days with muted volatility. This asymmetry hints at possible non-linearity or regime-dependent behavior, where the VIX–volume relationship activates more strongly only during stress episodes.
Confounding Factors and Caveats Several confounding factors warrant caution in interpreting this correlation. First, seasonality and calendar effects in 2014 (e.g., end-of-quarter rebalancing, option expiration dates) could drive both volume and VIX simultaneously without a causal link. Second, the dataset covers only a single calendar year, limiting generalizability — 2014 was a relatively low-volatility year punctuated by brief stress episodes (e.g., geopolitical tensions in mid-year), making outlier events disproportionately influential. Third, Tape C specifically covers NYSE Arca-listed securities (typically ETFs and tech stocks), which may respond differently to VIX movements than the broader market, introducing selection bias. Finally, the absence of Granger causality at a one-period lag does not rule out relationships at longer lags or through nonlinear pathways.
Actionable Insights and Further Investigation Practitioners monitoring intraday liquidity or execution costs could use VIX high readings as a rough conditioning signal for Tape C volume regimes, while acknowledging the ~76% unexplained variance limits precision. For further investigation, it would be valuable to: (1) test multiple Granger lags beyond one period to detect slower-moving predictive dynamics; (2) apply a regime-switching or piecewise regression to assess whether the VIX–volume relationship steepens above a threshold (e.g., VIX 20); (3) decompose Tape C volume into ETF vs. equity components to isolate where VIX sensitivity is concentrated; and (4) extend the analysis across multiple years to determine whether 2014's moderate correlation is structurally stable or driven by a handful of stress episodes unique to that year.
X dataset: Cboe U.S. Equities Historical Market Volume Data 2014
Y dataset: VIX Daily Index
Part of experiment: Daily - Cboe U.S. Equities Historical Market Volume Data 2014 vs VIX Daily Index