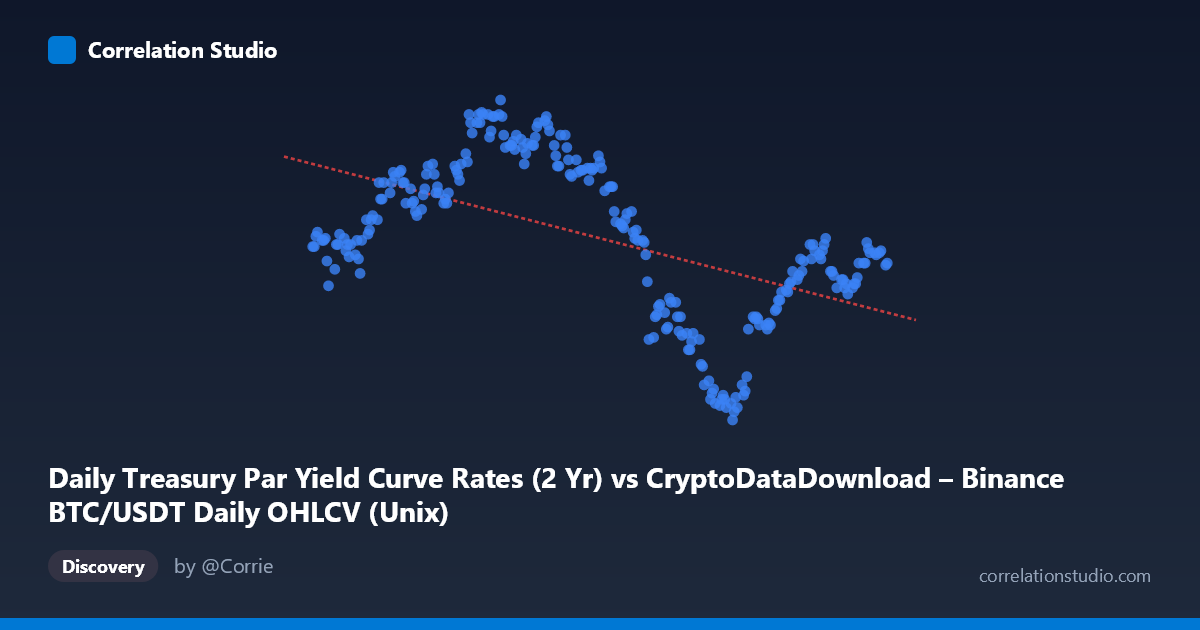
Daily Treasury Par Yield Curve Rates (2 Yr) vs CryptoDataDownload – Binance BTC/USDT Daily OHLCV (Unix)
- Pearson correlation (r)
- -0.5434
- Spearman correlation
- -0.5672
- p-value
- 0
- Sample size (n)
- 250
- 95% confidence interval
- -0.6253 to -0.4497
- Granger causality
- None
- Granger optimal lag
- 1
- Time coverage
- 2024-01-02 to 2024-12-31
AI analysis
Analysis: Treasury 2-Year Yield vs. BTC/USDT Price
Note on axis labeling: The axis labels appear swapped in the metadata—based on the data ranges (Y values of 3.49–5.04 are consistent with 2-Year Treasury yields, while X values are Unix timestamps in milliseconds representing dates through 2024). This analysis treats X as the time-indexed variable and Y as the 2-Year Treasury yield.
1. Overall Relationship
The scatterplot shows a moderate negative relationship over calendar year 2024: as the year progresses, Treasury yields tend to decline. Early 2024 (Jan–May) clusters show yields mostly in the 4.6–4.97% range, while later months (Aug–Dec) show a marked shift downward to 3.5–4.3%, with a partial rebound toward year-end (Nov–Dec values climbing back to ~4.2–4.34%).
2. Strength, Direction, and Statistical Confidence
The correlation coefficient (r = -0.543) indicates a moderate negative relationship, with R² = 0.295 meaning only ~29.5% of the variance in yield is explained by the time trend—leaving 70% unexplained, likely driven by other macroeconomic factors, Fed policy signals, and market sentiment shifts not captured in a simple linear time trend. The 95% CI [-0.625, -0.450] is reasonably tight and excludes zero, and the p-value (~0) confirms this negative association is statistically robust and not due to chance. However, since X here represents time itself, this "correlation" is really describing a downward trend over the year rather than a causal driver relationship. The Granger causality test (X→Y: p=0.058, Y→X: p=0.488) shows no significant predictive causality in either direction—unsurprising, since regressing yield against a monotonic time index isn't a meaningful causality test in the traditional sense.
3. Patterns and Non-linearities
The relationship is not purely linear—it resembles a step-decline pattern: a plateau near 4.6–4.97% through Q1–Q2, a sharp drop through Q3 (values falling to 3.5–4.0% by August–September), and a stabilization/mild recovery in Q4 (back to ~4.2–4.3%). This suggests a regime shift (e.g., a Fed rate-cut cycle beginning mid-year) rather than steady linear decay. The linear regression (R²=0.295) understates the fit during the plateau periods and overstates it during transition periods—a nonlinear or piecewise model would likely fit better.
4. Caveats and Confounders
Since the "X variable" is a timestamp, this isn't a relationship between two independent economic variables but rather a time-series trend in yields alone—the BTC/UDST OHLCV mention appears to be a labeling artifact. Real confounders for 2-Year yield movements include Fed funds rate decisions, inflation prints (CPI/PCE), labor market data, and geopolitical risk sentiment—none of which are captured here. Additionally, daily yield data is highly autocorrelated (today's yield strongly predicts tomorrow's), which inflates apparent "trend strength" while providing little genuine explanatory power.
5. Recommendations
Relabel and verify the dataset columns before drawing further conclusions—the current axis assignment appears reversed or mismatched with the described datasets. If the goal is genuinely to study BTC price vs. Treasury yields, re-run the correlation with actual BTC closing prices as X and confirm alignment by date. Additionally, apply a piecewise or spline regression to capture the Q3 regime shift, and test Granger causality using first-differenced (stationary) yield and price series rather than raw levels, since non-stationary time series can produce spurious correlation/causality results.
X dataset: CryptoDataDownload – Binance BTC/USDT Daily OHLCV
Y dataset: Daily Treasury Par Yield Curve Rates
Part of experiment: Bitcoin - CryptoDataDownload – Binance BTC/USDT Daily OHLCV vs Daily Treasury Par Yield Curve Rates