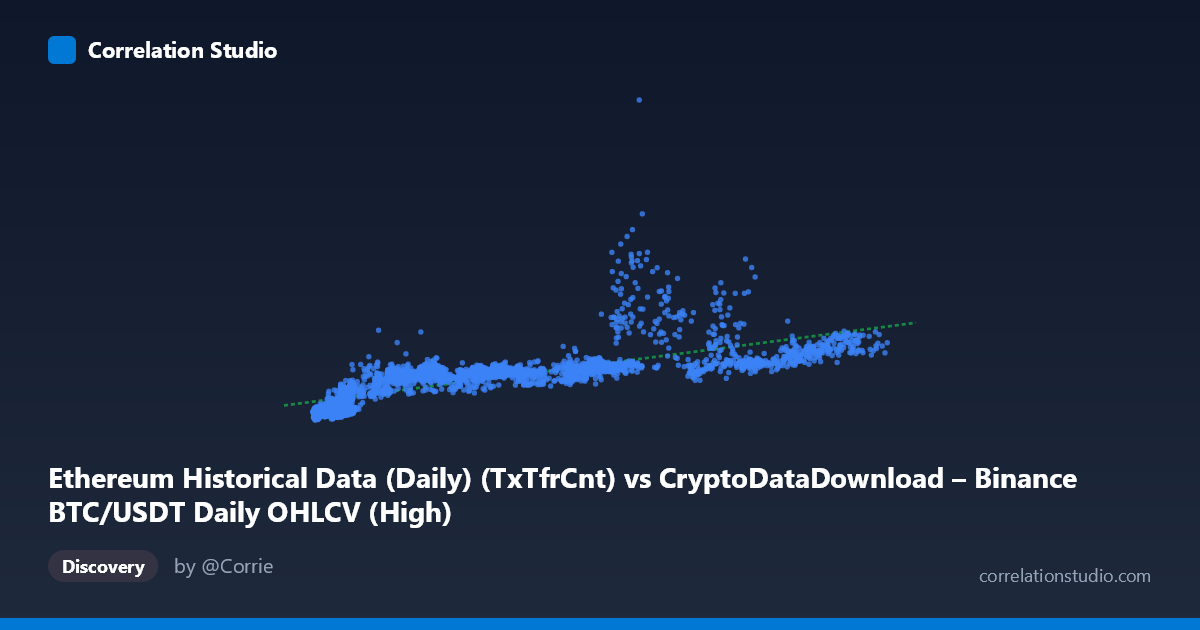
Ethereum Historical Data (Daily) (TxTfrCnt) vs CryptoDataDownload – Binance BTC/USDT Daily OHLCV (High)
- Pearson correlation (r)
- 0.7563
- Spearman correlation
- 0.9038
- p-value
- 0
- Sample size (n)
- 3191
- 95% confidence interval
- 0.741 to 0.7708
- Granger causality
- None
- Granger optimal lag
- 10
- Time coverage
- 2017-08-17 to 2026-05-20
AI analysis
Analysis: Ethereum Transaction Count vs. Bitcoin Daily High Price
1. Overview of the Relationship
The scatterplot displays a positive, moderately strong association between Ethereum's daily transaction count (X-axis) and Bitcoin's daily high price (Y-axis). Despite the mismatched labeling in the metadata (the axis titles appear to have been swapped between datasets), the underlying relationship is clear: as the X-metric increases, the Y-metric tends to increase as well, though with substantial scatter rather than a tight linear band. Data points cluster most heavily in the lower-left region (X < 40,000; Y < 1,200,000), with a diffuse, fan-shaped spread of higher values extending toward the upper right.
2. Strength, Direction, and Statistical Confidence
The Pearson correlation of r = 0.7563 indicates a fairly strong positive linear relationship, but r² = 0.572 tells the more important story: only about 57% of the variance in one variable is explained by the other, leaving 43% unexplained — driven by other factors, noise, or non-linear dynamics. The tight 95% confidence interval [0.741, 0.771] combined with a p-value of essentially 0 confirms this correlation is not a statistical fluke; it's a robust, reproducible pattern in this sample of 3,191 points. However, statistical significance should not be conflated with strength of predictive power — 57% variance explained leaves considerable room for error in any forecasting application.
Critically, the Granger causality tests show no significant predictive direction in either direction (X→Y: p=0.549; Y→X: p=0.607) even at an optimal lag of 10 periods. This means that despite the contemporaneous correlation, neither series reliably leads or predicts the other over time. This strongly suggests the correlation is driven by a shared external factor (most plausibly overall crypto market cycles, sentiment, or macro liquidity conditions) rather than one variable causally driving the other.
3. Notable Patterns and Non-linear Features
The point-by-point sample reveals a fan/cone-shaped dispersion: at low X values (~4,000–10,000), Y is tightly bounded (~200,000–650,000), but as X grows past 60,000–100,000, Y spreads dramatically — ranging from ~1,000,000 to over 2,600,000 (e.g., the point at X=68,653 → Y=2,698,591 stands out as a high-leverage outlier relative to neighbors with similar X but Y near 1,000,000–1,800,000). This heteroscedastic fan pattern, combined with the note that Spearman's ρ exceeds Pearson's r, strongly suggests the true relationship is non-linear — likely logarithmic, power-law, or saturating in shape rather than a straight line. A log-transform of X (or both variables) would likely tighten the fit and is worth testing (e.g., log-log regression or polynomial terms).
4. Confounding Factors and Caveats
Several caveats limit causal interpretation: - Shared market regime: Both BTC price and ETH network activity are driven by common crypto-market-wide sentiment, liquidity, and adoption cycles — a classic confound producing spurious-looking correlation. - Non-stationarity: Both series likely trend upward over the multi-year window (2017–2026), and correlating two trending time series can inflate r even without genuine linkage. - Metadata inconsistency: The axis descriptions swap "TxTfrCnt" and "High" price labels between BTC and ETH datasets — this should be verified before drawing conclusions, as it affects interpretation of which variable is which. - Time aggregation: Daily granularity may mask lead-lag relationships that occur at sub-daily or weekly resolution, potentially explaining the null Granger result.
5. Recommendations for Further Investigation
1. Verify and correct axis/column labeling to ensure the right variables are being compared. 2. Test log-log or polynomial regression given the Spearman/Pearson discrepancy and fan-shaped residuals — this should improve explained variance. 3. Difference or detrend both series (e.g., % daily returns/changes) before re-running correlation and Granger tests to remove spurious trend-driven correlation and isolate genuine short-term co-movement. 4. Introduce a third variable (e.g., total crypto market cap, BTC dominance, or gas fees) as a control to test whether the BTC-ETH link is mediated by broader market conditions. 5. Given the lack of Granger causality, avoid using one series to forecast the other in trading or modeling contexts; treat the relationship as descriptive/contemporaneous rather than predictive.
X dataset: CryptoDataDownload – Binance BTC/USDT Daily OHLCV
Y dataset: Ethereum Historical Data (Daily)
Part of experiment: Bitcoin - CryptoDataDownload – Binance BTC/USDT Daily OHLCV vs Ethereum Historical Data (Daily)