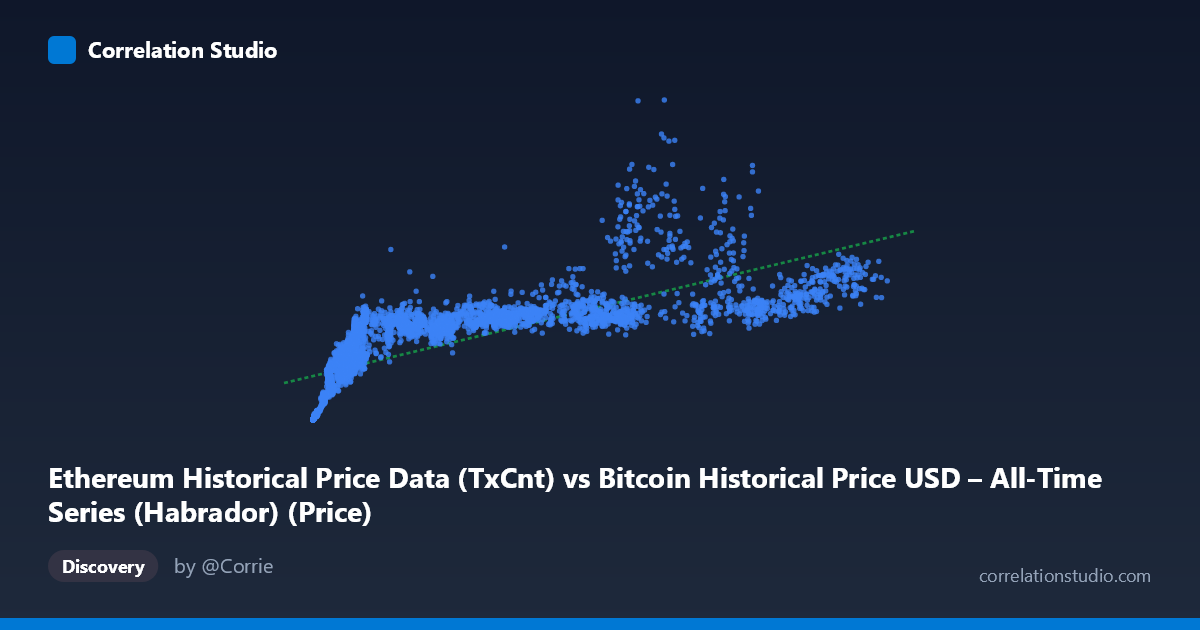
Ethereum Historical Price Data (TxCnt) vs Bitcoin Historical Price USD – All-Time Series (Habrador) (Price)
- Pearson correlation (r)
- 0.7654
- Spearman correlation
- 0.9362
- p-value
- 0
- Sample size (n)
- 3951
- 95% confidence interval
- 0.7522 to 0.778
- Granger causality
- None
- Granger optimal lag
- 10
- Time coverage
- 2015-07-30 to 2026-05-23
- Recomputed on refreshed data
- 2026-10-24 (r was 0.7644)
AI analysis
Analysis: Ethereum Transaction Count vs. Bitcoin Price
1. What the Visualization Reveals
The scatterplot shows a positive but distinctly non-linear relationship between Ethereum transaction count (X) and Bitcoin price (Y). At low X-values (roughly under 10,000 transactions), Y rises very steeply — small increases in transaction count correspond to large jumps in price, from single-digit thousands to over $1M. Beyond that threshold, the curve flattens considerably, with Y plateauing in a broad band between ~$1M and ~$1.2M even as X climbs into the tens of thousands. This produces a classic concave/logarithmic shape rather than a straight line, consistent with the note that Spearman's ρ exceeds Pearson's r.
2. Strength, Direction, and Uncertainty
The Pearson correlation (r = 0.7644) indicates a strong positive linear association, with r² = 0.5843 meaning the linear model explains about 58% of the variance in Y — leaving nearly 42% unexplained by X alone. The 95% CI [0.7511, 0.7771] is narrow, and with n=3,926 and p≈0, the correlation is highly statistically significant and not a product of sampling noise. However, statistical significance here reflects the large sample size and genuine trend, not necessarily a well-specified linear model — given the visible curvature, a log or polynomial fit would likely raise the explained variance substantially. Critically, the Granger causality tests show no significant predictive direction in either direction (X→Y: p=0.81; Y→X: p=0.87) at the optimal lag of 10 periods. This means neither series reliably "leads" the other in a time-series sense — the strong contemporaneous correlation is not evidence of temporal causality or lead/lag forecasting power.
3. Notable Patterns and Outliers
The data cluster heavily in a saturated horizontal band once X exceeds ~5,000–10,000, suggesting a ceiling effect — Bitcoin price seems to stabilize in a range regardless of further increases in Ethereum transaction volume. The steep-rise segment at very low X values (few hundred to a few thousand transactions, corresponding to early network history) drives much of the apparent linear correlation; without these early low-X/low-Y points anchoring the trend, the relationship in the "mature" regime looks nearly flat. A few high-X outliers (X 100,000) sit at high but not maximal Y values, not clearly extending the trend, hinting at either data anomalies or a genuine decoupling at network maturity. No distinct sub-clusters or multimodal groupings are evident beyond this curve shape.
4. Confounding Factors and Caveats
Both variables are essentially proxies for overall crypto-market growth over time (2015–2026), so this is very likely a case of shared temporal trend / co-integration rather than a direct causal link — both Ethereum activity and Bitcoin price have grown secularly with broader market adoption, making spurious correlation highly plausible. The mismatched column labels (X is labeled from the Ethereum dataset description but appears in a Bitcoin file, and vice versa for Y) also raise a data-provenance concern worth double-checking before drawing conclusions. Additionally, using raw (non-detrended) price and transaction-count series in a Pearson/Granger framework can produce misleading results when both series are non-stationary — differencing or log-transforming before re-testing would give a more reliable causal picture.
5. Suggestions for Further Investigation
Given the visible curvature, refit using a log-log or log-linear model to see if R² improves markedly — this would better capture the diminishing-returns relationship. Given the lack of Granger causality, avoid using either series to "predict" the other in forecasting models; instead, treat both as co-moving with a common underlying driver (likely overall crypto market cycles/adoption). It would also be valuable to test the relationship on detrended or differenced (% change) data to check whether the correlation persists once the shared long-term growth trend is removed — this is the more rigorous way to assess genuine short-term co-movement versus a shared macro trend. Finally, verify the axis/dataset labeling, since the description mismatch could indicate a data-merge error affecting interpretation.
X dataset: Bitcoin Historical Price USD – All-Time Series (Habrador)
Y dataset: Ethereum Historical Price Data
Part of experiment: Bitcoin - Bitcoin Historical Price USD – All-Time Series (Habrador) vs Ethereum Historical Price Data