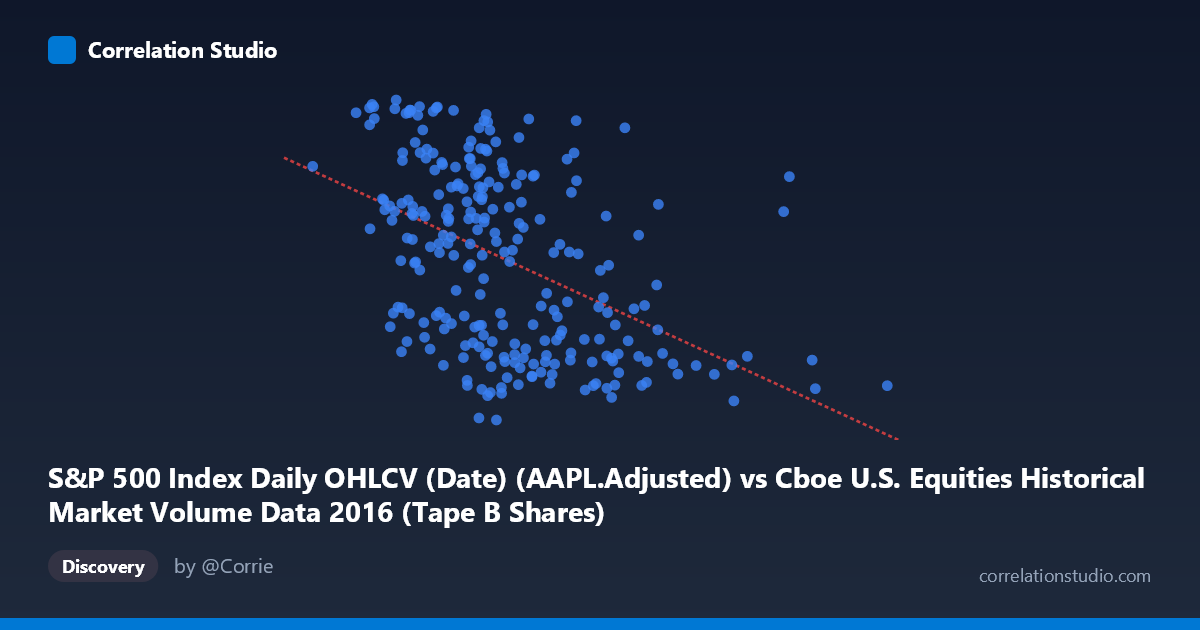
S&P 500 Index Daily OHLCV (Date) (AAPL.Adjusted) vs Cboe U.S. Equities Historical Market Volume Data 2016 (Tape B Shares)
- Pearson correlation (r)
- -0.4614
- Spearman correlation
- -0.4865
- p-value
- 0
- Sample size (n)
- 252
- 95% confidence interval
- -0.5534 to -0.3582
- Granger causality
- None
- Granger optimal lag
- 1
AI analysis
Analysis: AAPL Adjusted Price vs. Cboe Tape B Share Volume (2016)
Relationship Overview The scatterplot reveals a negative relationship between Apple's adjusted closing price (X-axis) and Cboe Tape B share volume (Y-axis) across 252 trading days in 2016. As AAPL's price increases, Tape B share volume tends to decline, and vice versa. This inverse pattern is visible in the data — lower AAPL price values (clustering around 75–100M range) are associated with higher Tape B volume readings (105–117), while higher AAPL prices (130–235M range) tend to correspond with lower volume readings (90–103). The linear regression equation y = -1.219e-07x + 116.214 captures this downward trend, though the scatter around the regression line is considerable.
Correlation Strength and Statistical Significance The Pearson correlation of r = -0.4614 indicates a moderate negative association. However, r² = 0.2129 means that only 21.3% of the variance in Tape B volume is explained by AAPL's adjusted price — leaving nearly 79% of variation attributable to other factors. While the correlation is statistically robust (p = 1.088E-14, effectively zero, with n = 252), the 95% confidence interval of [-0.5534, -0.3582] confirms the effect is reliably negative but moderate in magnitude. Critically, Granger causality tests find no significant predictive directionality in either direction (X→Y: F = 0.9141, p = 0.340; Y→X: F = 0.4036, p = 0.526). This means that neither variable's past values meaningfully predict the other's future values at a one-period lag, suggesting the observed correlation reflects concurrent co-movement or shared external drivers rather than a lead-lag causal mechanism.
Notable Patterns, Clusters, and Outliers The data exhibits a somewhat heteroscedastic spread — variability in Tape B volume appears wider at lower AAPL price levels and tighter at higher price levels, suggesting the relationship is not perfectly uniform across the price range. A notable cluster exists in the 90–110M AAPL price zone, where Tape B volume spans the full range from ~89 to ~117, indicating high within-cluster variability that weakens the linear fit. A few apparent outliers stand out: the point near (170M, 93.80) and (233M range) represent elevated AAPL prices with suppressed volume, consistent with the overall trend but sitting at the extreme right tail. There is no strong evidence of a non-linear (e.g., curvilinear) pattern in the visible sample points, though the wide scatter suggests a linear model captures only a rough signal.
Confounding Factors and Interpretive Caveats Several important caveats apply. First, Tape B volume reflects trading across multiple smaller exchanges (NYSE American, NYSE Arca, etc.) and is driven by macro market conditions, regulatory changes, and competing asset activity — not specifically by AAPL's price. Second, AAPL's adjusted price in 2016 was influenced by earnings cycles, product launches, and broader tech-sector sentiment, all of which may independently affect market-wide volume patterns. Third, the temporal structure of the data matters: both series evolve over time in 2016 (AAPL recovered from early-year lows), meaning the apparent correlation may partially reflect shared trending behavior rather than a true functional relationship. Serial autocorrelation in daily financial data can also inflate the apparent statistical significance. Finally, the axis labels suggest a possible dataset join artifact — the X and Y column descriptors appear swapped between dataset names, warranting verification that variables are correctly assigned.
Actionable Insights and Further Investigation Given the moderate correlation and absent Granger causality, practitioners should not use AAPL price as a predictive signal for Tape B volume in a trading or operational context. Instead, further investigation should explore: (1) multivariate modeling incorporating VIX (volatility index), overall S&P 500 level, and market-wide volume to isolate whether AAPL price adds explanatory power beyond macro conditions; (2) regime segmentation — splitting the 2016 data into pre- and post-election periods may reveal structural breaks in the relationship; (3) testing longer lag structures in Granger causality (beyond lag 1) to rule out slower feedback dynamics; and (4) examining nonlinear specifications (e.g., spline regression or quantile regression) to determine whether the relationship strengthens at price extremes. Confirming the correct variable-to-dataset mapping is also a recommended first step before drawing any substantive conclusions.
X dataset: Cboe U.S. Equities Historical Market Volume Data 2016
Y dataset: S&P 500 Index Daily OHLCV (Date)
Part of experiment: Daily - Cboe U.S. Equities Historical Market Volume Data 2016 vs S&P 500 Index Daily OHLCV (Date)