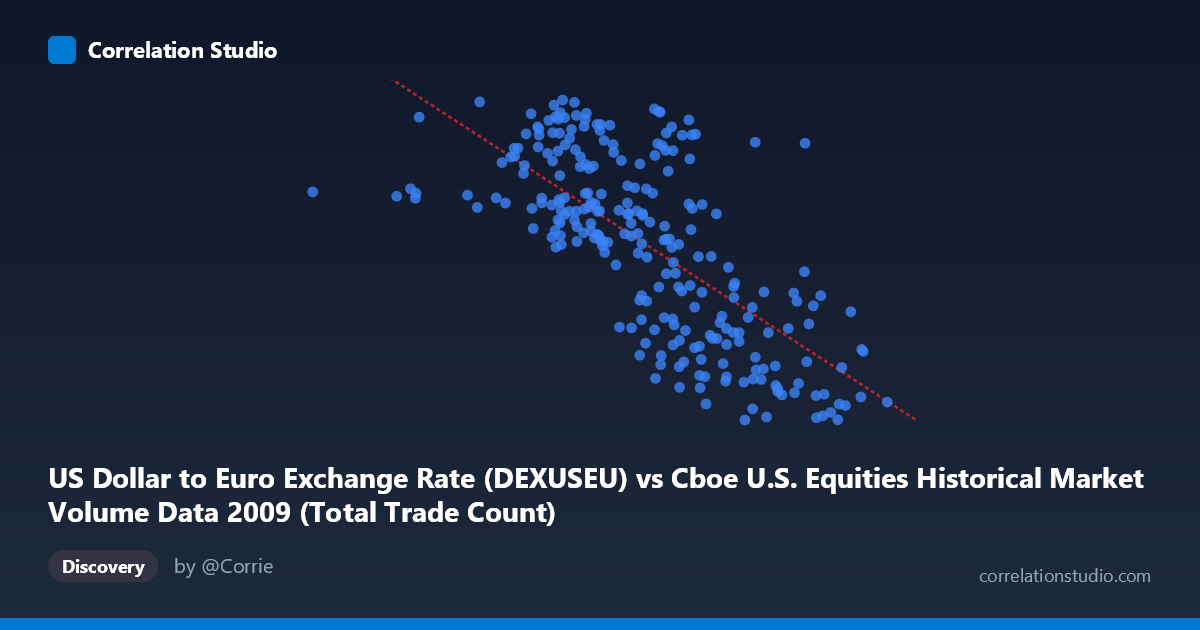
US Dollar to Euro Exchange Rate (DEXUSEU) vs Cboe U.S. Equities Historical Market Volume Data 2009 (Total Trade Count)
- Pearson correlation (r)
- -0.7016
- Spearman correlation
- -0.7103
- p-value
- 0
- Sample size (n)
- 250
- 95% confidence interval
- -0.7596 to -0.6326
- Granger causality
- None
- Granger optimal lag
- 1
AI analysis
Analysis: US Dollar to Euro Exchange Rate vs. Cboe Equity Market Total Trade Count (2009)
Relationship Overview
The scatterplot reveals a moderately strong negative relationship between the US Dollar to Euro exchange rate and total trade count in US equity markets during 2009. As the USD/EUR exchange rate increases (meaning the dollar strengthens relative to the euro, or equivalently the euro becomes cheaper in dollar terms), the total number of equity trades tends to decline. The linear regression equation (y = -8.50×10⁻⁸x + 1.621) confirms this inverse relationship, with higher trade volume activity clustering around lower exchange rate values and diminishing as the rate rises. This pattern suggests that periods of dollar weakness — when the euro was more expensive — coincided with heightened trading activity in US equities, consistent with the elevated market volatility and crisis-era dynamics of early 2009.
Correlation Strength and Statistical Significance
The Pearson correlation of r = -0.70 represents a moderately strong negative association, and the R² of 0.492 means that approximately 49.2% of the variance in total trade count is statistically explained by variation in the exchange rate — a notably substantial share for a cross-domain financial relationship. The 95% confidence interval of [-0.760, -0.633] is relatively tight and lies entirely in negative territory, reinforcing high confidence that the true population relationship is genuinely inverse. The p-value of effectively zero, drawn from a population of N = 3,232 daily observations, makes random chance an implausible explanation. However, the Granger causality results tell a critical story: neither direction (X→Y: F = 0.45, p = 0.50; Y→X: F = 1.98, p = 0.16) approaches significance at conventional thresholds. This means that knowing today's exchange rate does not meaningfully improve prediction of tomorrow's trade count, and vice versa — the correlation reflects co-movement driven by shared underlying forces rather than any direct temporal predictive relationship between the two variables.
Notable Patterns and Outliers
Several structural features stand out in the data. There is a visible concentration of high trade count values (Y ≈ 1.44–1.51) clustered at lower exchange rates (X ≈ 1.25–1.35), which likely corresponds to early 2009 during peak post-financial-crisis volatility when the dollar was relatively strong and equity trading volumes were extraordinarily elevated. Conversely, as the exchange rate rises above ~1.45–1.50 (dollar weakening through mid-to-late 2009 recovery), trade counts compress toward lower values. A few points at extreme X values — notably around X = 629,671 and X = 4,134,002 — appear as potential outliers at the tails and warrant scrutiny for data integrity or exceptional market events. The relationship also shows modest heteroscedasticity, with greater dispersion in trade counts at intermediate exchange rate levels, suggesting the linear model captures the central tendency but not the full distributional complexity.
Confounding Factors and Caveats
The most significant caveat is that both variables are jointly driven by the 2008–2009 global financial crisis trajectory. The crisis caused simultaneous dollar appreciation (safe-haven flows) and explosive equity trading volumes in early 2009, while the subsequent recovery phase saw the dollar soften and market volumes normalize — creating a spurious-looking correlation that is largely a shared time trend rather than a causal mechanism. Additionally, equity trade counts are influenced by market structure changes, algorithmic trading growth, and regulatory events, none of which relate directly to currency markets. The Granger non-causality result strongly supports this confounding interpretation. The dataset's single-year scope (2009) also limits generalizability, as the correlation may be an artifact of one extraordinary macroeconomic episode rather than a stable structural relationship.
Actionable Insights and Further Investigation
Despite the absence of Granger causality, the strength of co-movement (R² ≈ 0.49) merits further decomposition. Recommended next steps include: (1) Detrending both series to remove the shared crisis-recovery trajectory before re-estimating correlation, which would clarify whether any residual relationship persists beyond the common time trend; (2) Extending the analysis across multiple years (2007–2012) to test whether the correlation is specific to 2009 or reflects a more durable dynamic; (3) Introducing mediating variables such as the VIX volatility index, S&P 500 returns, or Federal Reserve policy indicators, which likely explain both series simultaneously; (4) Testing non-linear models given the visible curvature and heteroscedasticity in the scatter; and (5) examining whether specific exchange rate regimes or threshold levels act as structural breaks in the trading volume relationship. The absence of predictive directionality suggests practitioners should not use exchange rates as a trading volume signal in isolation, but the co-movement may still be useful as a macro-regime indicator within a broader multivariate framework.
X dataset: Cboe U.S. Equities Historical Market Volume Data 2009
Y dataset: US Dollar to Euro Exchange Rate
Part of experiment: Daily - Cboe U.S. Equities Historical Market Volume Data 2009 vs US Dollar to Euro Exchange Rate