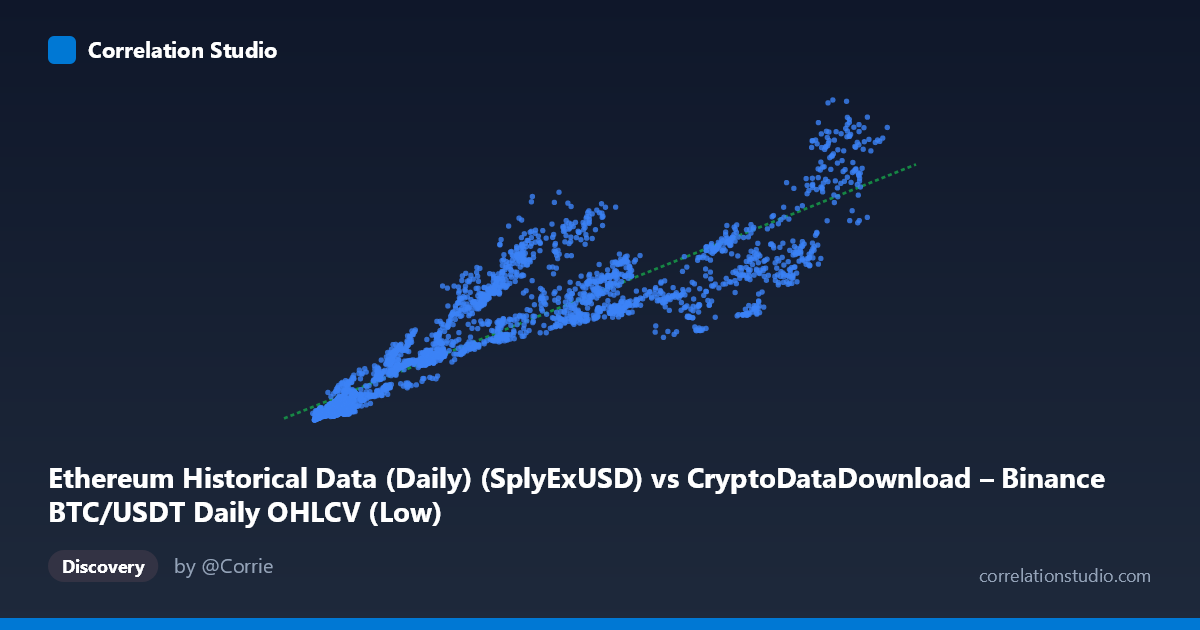
Ethereum Historical Data (Daily) (SplyExUSD) vs CryptoDataDownload – Binance BTC/USDT Daily OHLCV (Low)
- Pearson correlation (r)
- 0.9043
- Spearman correlation
- 0.9431
- p-value
- 0
- Sample size (n)
- 3191
- 95% confidence interval
- 0.8978 to 0.9105
- Granger causality
- None
- Granger optimal lag
- 10
- Time coverage
- 2017-08-17 to 2026-05-20
AI analysis
Analysis of the Relationship Between Ethereum Supply (X) and BTC/USDT Daily Low (Y)
1. What the Visualization Reveals
The scatterplot shows a strong positive, generally monotonic relationship between the X variable (labeled as Ethereum's circulating supply excluding exchange holdings, SplyExUSD) and the Y variable (labeled as BTC/USDT daily low price). As X increases from roughly 2,800 to 123,000, Y climbs from ~$1.4B to ~$95.6B on a comparable scale. The data forms a fairly tight upward-sloping band rather than a diffuse cloud, indicating the two series move together consistently across the full range, though with noticeable scatter/heteroskedasticity increasing at higher X values.
2. Strength, Direction, and Statistical Confidence
The Pearson correlation of r = 0.904 indicates a strong positive linear association, with r² = 0.818 meaning approximately 82% of the variance in Y is statistically explainable by a linear function of X — a substantial fit, though it leaves ~18% of variance driven by other factors or noise. The 95% CI [0.898, 0.911] is tight given the large sample (n=3,191), and the p-value of ~0 confirms this correlation is highly unlikely to be due to chance. However, this is a classic case where correlation must not be conflated with causation: the Granger causality tests show no significant predictive direction in either direction (X→Y: p=0.82; Y→X: p=0.79) even at an optimal lag of 10 periods. This strongly suggests the relationship is not one variable temporally driving the other, but rather both series responding to a shared underlying trend — most likely the general secular growth of the cryptocurrency market and time itself.
3. Notable Patterns and Outliers
The sample points reveal some interesting deviations from strict linearity: for instance, at X≈34,757 Y jumps to ~39.4B (higher than several points with larger X like 63,888 → 31.8B), and at X≈9,900 Y is anomalously high (12.5B) relative to neighboring X values in the 8,000-11,000 range (~4-7B). This suggests period-specific volatility or regime shifts (e.g., bull/bear market phases) causing vertical dispersion at similar X levels. The relationship also appears to flatten or show more scatter at higher X values (80,000), hinting at possible saturation or increased noise as both metrics reach historical extremes — consistent with crypto market cycles where price surges can decouple temporarily from underlying network fundamentals.
4. Confounding Factors and Caveats
The most critical caveat is temporal confounding: both variables are time series spanning 2017-2026, and cryptocurrency markets have exhibited strong secular growth over this period. Any two upward-trending time series (e.g., Ethereum supply metrics and Bitcoin price) will show spurious high correlation simply because they both increase over time, independent of any genuine economic linkage. The lack of Granger causality reinforces that this is likely a trend-driven spurious correlation rather than a functional relationship. Additionally, mixing an Ethereum on-chain supply metric with a Bitcoin price metric conflates two different assets/mechanisms — macro crypto market sentiment (bull runs, halving cycles, regulatory news) likely drives both simultaneously.
5. Actionable Insights and Further Investigation
Given the non-causal relationship, this correlation should not be used for predictive trading or forecasting models linking ETH supply to BTC price. Instead, analysts should: (a) detrend both series (e.g., using differencing or log-returns) and re-test correlation/causality to check if the relationship holds after removing the shared time trend; (b) control for known crypto market cycle phases (bull/bear regimes) as a categorical variable to see if correlation strength varies by regime; (c) investigate whether a third common driver (e.g., overall crypto market cap, or Bitcoin's own price acting as a proxy for market-wide sentiment) better explains the co-movement; and (d) examine the anomalous points identified above (e.g., X≈9,900 and X≈34,757) to determine if they correspond to specific market events worth flagging as regime-shift markers.
X dataset: CryptoDataDownload – Binance BTC/USDT Daily OHLCV
Y dataset: Ethereum Historical Data (Daily)
Part of experiment: Bitcoin - CryptoDataDownload – Binance BTC/USDT Daily OHLCV vs Ethereum Historical Data (Daily)