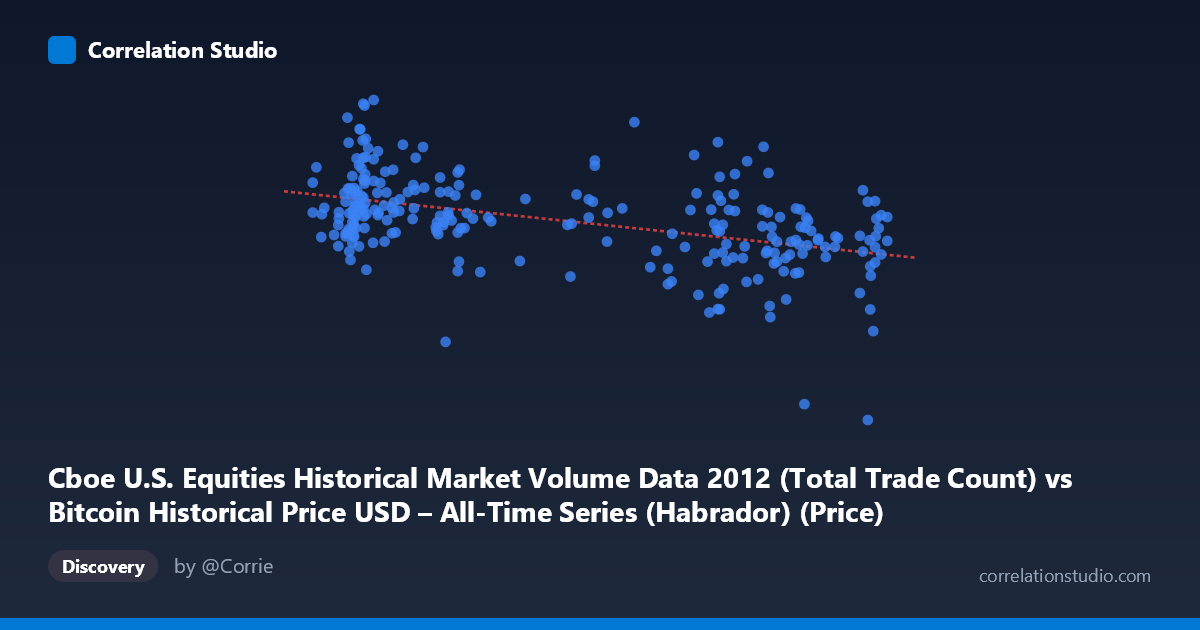
Cboe U.S. Equities Historical Market Volume Data 2012 (Total Trade Count) vs Bitcoin Historical Price USD – All-Time Series (Habrador) (Price)
- Pearson correlation (r)
- -0.462
- Spearman correlation
- -0.4438
- p-value
- 0
- Sample size (n)
- 250
- 95% confidence interval
- -0.5543 to -0.3585
- Granger causality
- None
- Granger optimal lag
- 10
AI analysis
Analysis: Cboe Equities Trade Count vs. Bitcoin Price (2012)
1. Relationship Overview
The scatterplot displays a moderate negative linear relationship between Cboe U.S. equities trade count (X) and Bitcoin price (Y) across 250 sampled trading days in 2012. As trade count increases from roughly 4.3 to 13.7 (units), Bitcoin price tends to decline from a high of ~$2.28M-scale readings toward lower values, though with substantial scatter around the trend line. The regression line (y = -34,000.3x + 1,929,130) confirms this downward slope, but the wide dispersion of points around it signals that X alone is a weak-to-moderate predictor of Y.
2. Strength, Direction, and Statistical Confidence
The correlation coefficient (r = -0.462) indicates a moderate negative relationship. However, r² = 0.2135 reveals that only 21.3% of the variance in Bitcoin price is explained by trade count — meaning nearly 79% of the variability is driven by other factors entirely outside this relationship. The 95% CI [-0.554, -0.359] is reasonably tight and entirely negative, and the p-value (1.27×10⁻¹⁴) confirms this correlation is highly statistically significant and not due to chance — but statistical significance here reflects the large sample size, not necessarily practical strength. Critically, the Granger causality test found no significant predictive direction in either direction (X→Y: p=0.369; Y→X: p=0.503). This means neither variable helps forecast the other's future values based on past data — the correlation appears to be contemporaneous/coincidental rather than causal or lead-lag in nature.
3. Patterns and Clusters
The data shows two loose clusters: one around X≈5–6 with higher, more variable Y values (often $1.6M–$2.28M range), and another around X≈10–12.5 with generally lower and tighter Y values (~$1.2M–$1.9M). Within the low-X cluster, there's notable vertical spread (e.g., X=4.86 yields both $1.59M and $2.06M), suggesting high variance unexplained by X in that region. No strong nonlinear curvature or extreme outliers dominate the pattern — the relationship looks like a noisy linear decline rather than an exponential or threshold effect.
4. Confounding Factors and Caveats
This is almost certainly a spurious correlation driven by shared temporal trends rather than genuine economic linkage. Both series are time-indexed throughout 2012: Bitcoin was in a distinct early-adoption growth phase with independent volatility drivers (exchange activity, speculative demand, mining economics), while Cboe equity trade counts reflect unrelated U.S. stock market mechanics. Any correlation is more likely attributable to coincidental co-trending over the year (e.g., both series drifting or cycling independently) rather than a causal link. The mismatched dataset descriptions (X and Y labels appear swapped in the metadata) also warrant a sanity check on data provenance.
5. Suggestions for Further Investigation
Given the lack of Granger causality and modest r², this relationship should not be used for predictive modeling between these two markets. Recommended next steps: (a) detrend or difference both series to test if the correlation persists after removing shared temporal drift, (b) check for a common confounding variable (e.g., overall market volatility, macroeconomic sentiment, or calendar effects) that might independently drive both, and (c) verify data alignment/labeling given the axis description inconsistency. If a genuine link is suspected, higher-frequency intraday data or event-study methods around specific volume spikes would better test for real interaction.
X dataset: Bitcoin Historical Price USD – All-Time Series (Habrador)
Y dataset: Cboe U.S. Equities Historical Market Volume Data 2012
Part of experiment: Bitcoin - Bitcoin Historical Price USD – All-Time Series (Habrador) vs Cboe U.S. Equities Historical Market Volume Data 2012