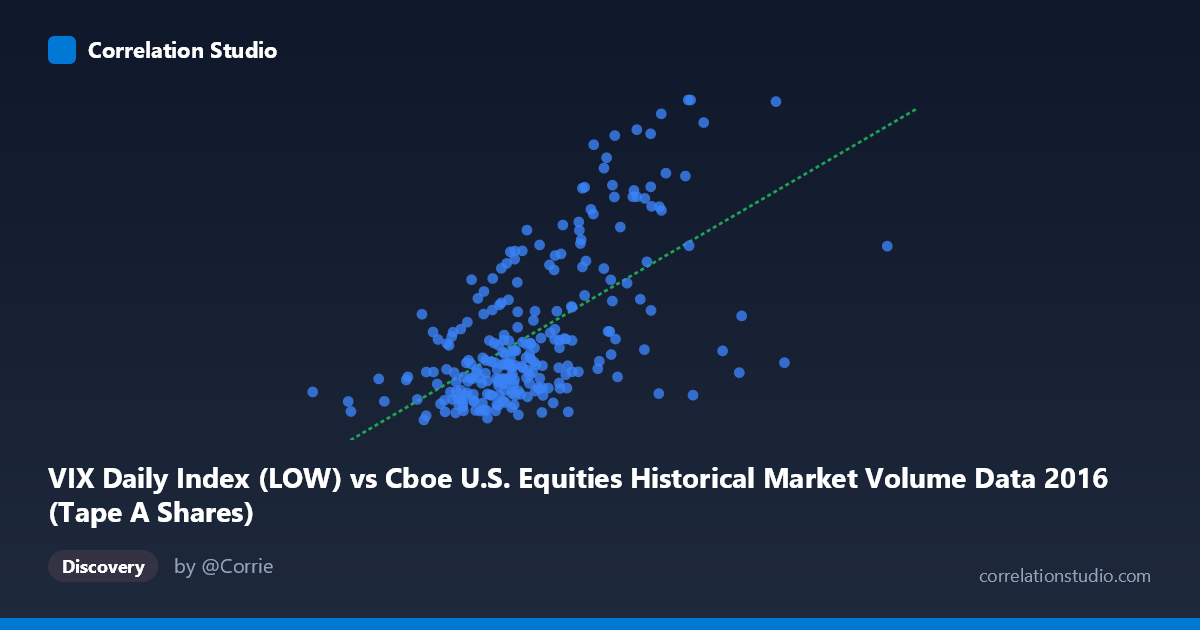
VIX Daily Index (LOW) vs Cboe U.S. Equities Historical Market Volume Data 2016 (Tape A Shares)
- Pearson correlation (r)
- 0.6076
- Spearman correlation
- 0.5753
- p-value
- 0
- Sample size (n)
- 252
- 95% confidence interval
- 0.5233 to 0.6801
- Granger causality
- None
- Granger optimal lag
- 1
AI analysis
Scatterplot Analysis: VIX Tape A Shares vs. VIX Daily Index (Low)
Relationship Overview
The scatterplot reveals a moderate positive relationship between the VIX Daily Index Low values and Tape A Shares volume for U.S. equities in 2016. As the VIX Low increases — indicating higher baseline market anxiety on a given day — Tape A share volume tends to rise correspondingly. The linear regression equation (y = 3.779×10⁻⁸x + 4.860) confirms this upward trend, which aligns intuitively with the well-established market dynamic that elevated volatility tends to drive increased trading activity as investors reposition, hedge, or react to uncertainty.
Correlation Strength and Statistical Significance
The Pearson correlation of r = 0.608 reflects a moderate positive association, but the coefficient of determination (r² = 0.369) is the more sobering figure: only 36.9% of the variance in Tape A Shares is explained by the VIX Low. This means roughly 63% of the variation in trading volume is driven by factors outside this relationship. The 95% confidence interval [0.523, 0.680] is relatively tight and does not approach zero, and the p-value of essentially 0 across n = 252 paired observations confirms the relationship is highly unlikely to be a statistical artifact. However, the Granger causality results tell a critical story: neither direction (X→Y nor Y→X) achieves significance (F = 0.595, p = 0.441 and F = 0.428, p = 0.514, respectively). This means that, despite the contemporaneous correlation, neither variable reliably predicts the other one period ahead — the relationship is associative, not temporally predictive.
Notable Patterns, Clusters, and Outliers
The sample points reveal notable clustering in the lower-left region of the plot, with many observations concentrated around VIX Low values of 220–280 million and Tape A Shares between 11–16. This dense cluster suggests relatively stable, low-volatility market conditions dominated much of 2016. More telling are the upper-right outliers — points such as (363M, 25.01), (335M, 21.90), (312M, 22.38), and (309M, 19.61) — which likely correspond to discrete volatility events such as the Brexit vote (June 2016) or the U.S. presidential election (November 2016). These high-leverage outliers may be disproportionately driving the observed correlation, and the relationship may be considerably weaker if those episodic events were removed. There is also a hint of heteroscedasticity: variance in Tape A Shares appears to increase at higher VIX Low values, suggesting the linear model may underfit the high-volatility regime.
Confounding Factors and Caveats
Several confounding factors warrant caution. First, both variables may be jointly driven by a common latent factor — major macro events or news shocks — rather than one causing the other, which is precisely what the failed Granger tests suggest. Second, the VIX Low is itself derived partly from options market activity, which is not entirely independent of equity trading volume, introducing potential circularity. Third, the dataset spans only one calendar year (2016), which was notable for two extraordinary political events; generalizing findings beyond this window should be done carefully. Finally, day-of-week effects, quarterly rebalancing cycles, and index reconstitution dates could systematically inflate both measures simultaneously without any genuine causal link.
Actionable Insights and Further Investigation
Given that the contemporaneous correlation is real but temporal predictability is absent, practitioners should not use VIX Low as a leading indicator for next-day Tape A volume (or vice versa). Instead, both variables likely respond simultaneously to common information arrival. Further investigation should explore: (1) regime-segmented analysis separating low-VIX periods (VIX < 15) from elevated-VIX periods to test whether the correlation strengthens nonlinearly under stress; (2) multivariate models incorporating additional predictors such as S&P 500 returns, bid-ask spreads, or news sentiment to better explain the remaining 63% of variance; and (3) replication across multiple years to determine whether 2016's political volatility events inflate the correlation beyond what would be observed in calmer market environments. A rolling-window correlation analysis could also reveal whether this relationship is stable or episodic throughout the year.
X dataset: Cboe U.S. Equities Historical Market Volume Data 2016
Y dataset: VIX Daily Index
Part of experiment: Daily - Cboe U.S. Equities Historical Market Volume Data 2016 vs VIX Daily Index