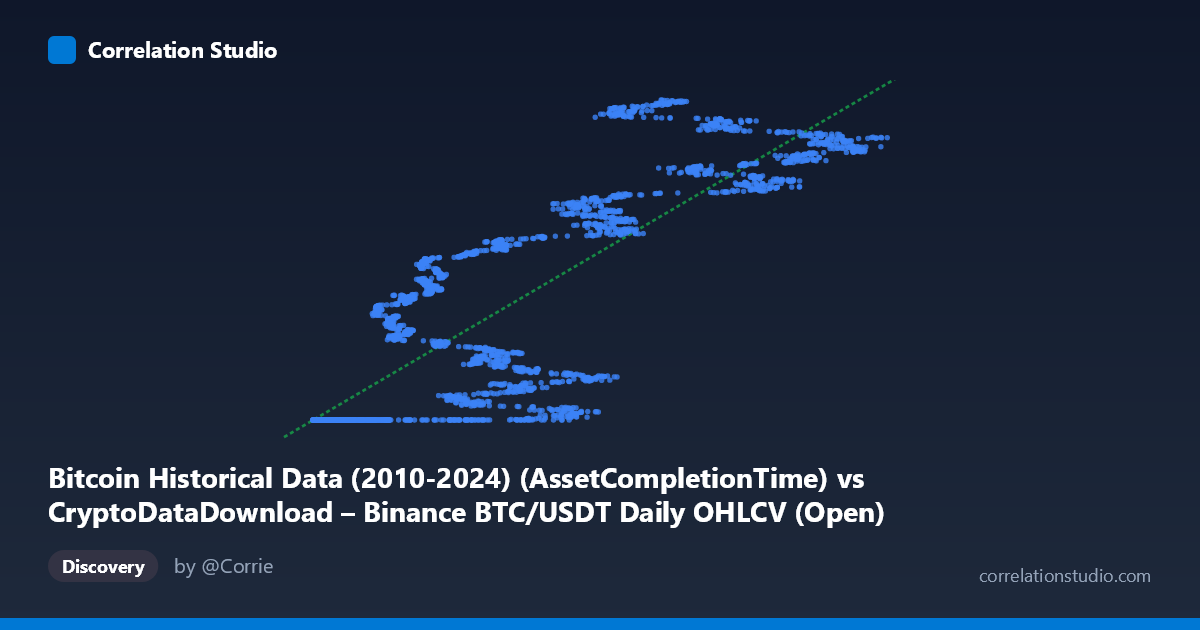
Bitcoin Historical Data (2010-2024) (AssetCompletionTime) vs CryptoDataDownload – Binance BTC/USDT Daily OHLCV (Open)
- Pearson correlation (r)
- 0.8518
- Spearman correlation
- 0.8876
- p-value
- 0
- Sample size (n)
- 3191
- 95% confidence interval
- 0.842 to 0.8611
- Granger causality
- None
- Granger optimal lag
- 10
AI analysis
Analysis: Bitcoin "Asset Completion Time" vs. BTC/USDT Open Price
1. What the Visualization Reveals
The scatterplot depicts a relationship between an X-axis variable labeled as "AssetCompletionTime" (ranging from ~3,188 to 124,658) and the daily Open price of BTC/USDT (ranging from ~$1.61B to $1.78B — note this appears to be a scaled or mislabeled price field, likely representing something other than raw dollar price, possibly a cumulative or index value). The sample points show a distinctive pattern: a large cluster of low-X values (roughly 3,000–20,000) are tightly bound to a narrow Y-band near 1,614,337,000–1,614,338,000, while higher X-values spread Y across a much wider range (1,660,000,000 to 1,779,000,000). This suggests a non-linear, threshold-like relationship rather than a simple linear one, despite the positive linear fit.
2. Strength, Direction, and Uncertainty
The correlation coefficient (r = 0.852, R² = 0.726) indicates a strong positive relationship, with X explaining about 72.6% of the variance in Y. The 95% CI [0.842, 0.861] is tight given the large sample (n=3,191), and the p-value of ~0 confirms this correlation is highly statistically significant — essentially no chance this is due to random sampling. However, statistical significance does not imply causation, and the Granger causality tests reinforce this: neither direction (X→Y: p=0.333; Y→X: p=0.149) shows significant predictive causality at 10 lags. This means that despite the strong contemporaneous correlation, neither variable reliably "leads" or forecasts the other over time — the relationship may be driven by a shared underlying trend (e.g., both increasing over the 2017–2026 time span) rather than one causing the other.
3. Notable Patterns and Outliers
The data shows a compressed baseline cluster: many low-X points (X < 20,000) have nearly identical Y-values (~1,614,337,xxx), suggesting these may correspond to an early period with flat or placeholder pricing (possibly 2017 pre-listing data or a data artifact). Beyond this cluster, Y rises steeply and somewhat noisily with X, showing what looks like two regimes: a flat/suppressed early regime and a dynamic growth regime afterward. This bifurcation strongly suggests the relationship is not truly linear — R²=0.726 may be partly inflated by the wide separation between the flat cluster and the high-X/high-Y cluster, rather than a smooth continuous trend.
4. Confounding Factors and Caveats
Since X is time-derived ("AssetCompletionTime") and Y is BTC price-related, this is likely a spurious or trivially time-driven correlation — both variables may simply be tracking the passage of time or market maturation, not a direct causal mechanism. Bitcoin's price is influenced by countless external factors (macroeconomic conditions, regulatory news, adoption cycles) unrelated to "completion time." The flat cluster at low X values also raises data quality concerns — this could reflect padding, missing data imputation, or an artifact of how "AssetCompletionTime" was calculated for early dates.
5. Suggested Next Steps
Given the lack of Granger causality and the apparent regime-shift pattern, treat this correlation as descriptive, not predictive. Recommended follow-ups: (1) clarify what "AssetCompletionTime" actually represents and why early values cluster at a fixed Y; (2) test the relationship on log-transformed or de-trended data to control for shared time trends; (3) segment the analysis into the flat-cluster period vs. the dynamic period to check if correlation holds within regimes; and (4) investigate other covariates (volume, macro indices) that may better explain BTC price movements than this X variable alone.
X dataset: CryptoDataDownload – Binance BTC/USDT Daily OHLCV
Y dataset: Bitcoin Historical Data (2010-2024)
Part of experiment: Bitcoin - CryptoDataDownload – Binance BTC/USDT Daily OHLCV vs Bitcoin Historical Data (2010-2024)