Cboe U.S. Equities Historical Market Volume Data 2022 (Tape B Trade Count) vs Bitcoin Historical Price USD – All-Time Series (Habrador) (Price)
- Pearson correlation (r)
- 0.503
- Spearman correlation
- 0.4981
- p-value
- 0
- Sample size (n)
- 251
- 95% confidence interval
- 0.4044 to 0.5901
- Granger causality
- None
- Granger optimal lag
- 10
- Time coverage
- 2022-01-03 to 2022-12-30
- Recomputed on refreshed data
- 2026-10-24 (r was 0.503)
AI analysis
Analysis: Trade Count vs. Bitcoin Price (2022)
1. Overview of the Relationship
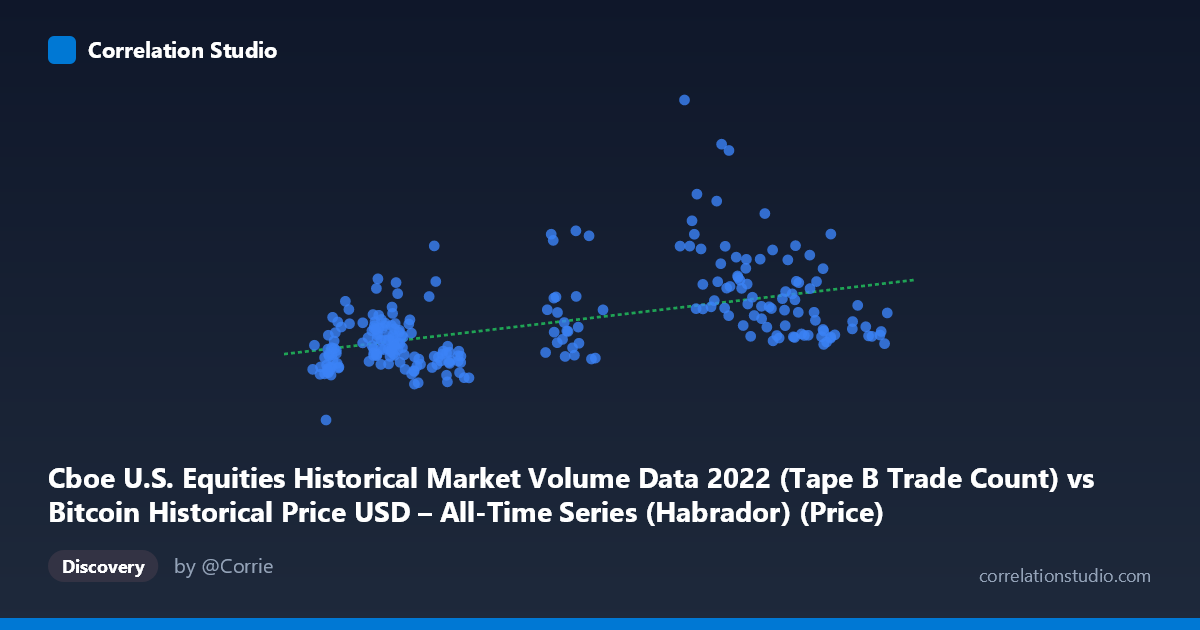
The scatterplot shows a positive but noisy relationship between Cboe U.S. equities Tape B trade count and Bitcoin's daily USD price throughout 2022. Points cluster into two rough bands: a dense lower-left grouping where X (trade count) sits in the 16,000–24,000 range paired with Y (price) mostly between 340,000–560,000, and a more dispersed upper region where X climbs to 28,000–44,000 with Y spreading widely from ~450,000 up to over 1,400,000. The overall visual impression is a loose upward-sloping cloud rather than a tight linear trend.
2. Strength, Direction, and Statistical Confidence
The correlation coefficient (r = 0.503) indicates a moderate positive relationship, but r² = 0.253 reveals that only about 25% of the variance in Bitcoin price is explained by trade count — leaving roughly 75% driven by other factors. The 95% CI [0.404, 0.590] is reasonably tight given n=251, and the p-value of 0 confirms the correlation is statistically significant and not due to chance. However, statistical significance here reflects sample size and consistency, not practical predictive strength — a moderate r² is far from sufficient for confident forecasting. Critically, the Granger causality tests show no significant predictive direction in either direction (X→Y: p=0.392; Y→X: p=0.483) even at an optimal lag of 10 periods. This strongly suggests the correlation is contemporaneous/coincidental rather than causal or lead-lag in nature — neither series meaningfully helps predict the other's future values based on past values alone.
3. Patterns, Clusters, and Outliers
Several notable features stand out: - Heteroscedasticity: Variance in Y increases sharply as X increases — the spread of prices at low trade counts (X<25,000) is much tighter than at high trade counts (X35,000), where prices range enormously (488,839 to 1,212,395 at similar X values ~38,000-41,000). - High-price outliers: Points like (38737, 1,212,395), (36700, 940,444), (40717, 968,368), and (28936/29048, ~865,000-888,000) sit well above the general trend, suggesting episodic price spikes (likely tied to Bitcoin's own volatility cycles) unrelated to trade count level. - Two-regime structure: The data may reflect two loosely separated time periods/market regimes (e.g., different quarters of 2022) rather than one continuous functional relationship — consistent with 2022's dramatic bear market decline.
4. Confounding Factors and Caveats
This is a classic spurious correlation risk scenario: both series are time-ordered macro/market variables in the same calendar year, and equities trade counts and Bitcoin price could each be driven by shared external factors (Fed rate hikes, general risk-sentiment, volatility regime shifts, liquidity conditions) rather than any direct mechanical link between Cboe equity trading activity and BTC price. The mismatched dataset descriptions (X labeled as Bitcoin dataset column, Y labeled as Cboe dataset column) also suggest possible column-mapping/data-merging errors — this pairing may be an artifact of joining two unrelated time series on date, not a meaningful economic relationship. Additionally, 2022 was a uniquely turbulent year (BTC fell ~65%), so any correlation may be regime-specific and non-generalizable.
5. Recommendations
Given the lack of Granger causality and modest r², this correlation should not be used for predictive trading or forecasting purposes. Recommended next steps: (1) verify data provenance/column mapping to rule out a spurious join; (2) test the relationship on log-returns or differenced series rather than levels, since both series likely have strong trends/autocorrelation that inflate level-correlation; (3) segment the analysis by quarter or volatility regime to check if the relationship is driven by specific sub-periods (e.g., the high-price cluster); (4) explore genuine confounders (VIX, interest rates, crypto-specific volume) as potential shared drivers rather than treating X and Y as directly linked.
X dataset: Bitcoin Historical Price USD – All-Time Series (Habrador)
Y dataset: Cboe U.S. Equities Historical Market Volume Data 2022
Part of experiment: Bitcoin - Bitcoin Historical Price USD – All-Time Series (Habrador) vs Cboe U.S. Equities Historical Market Volume Data 2022