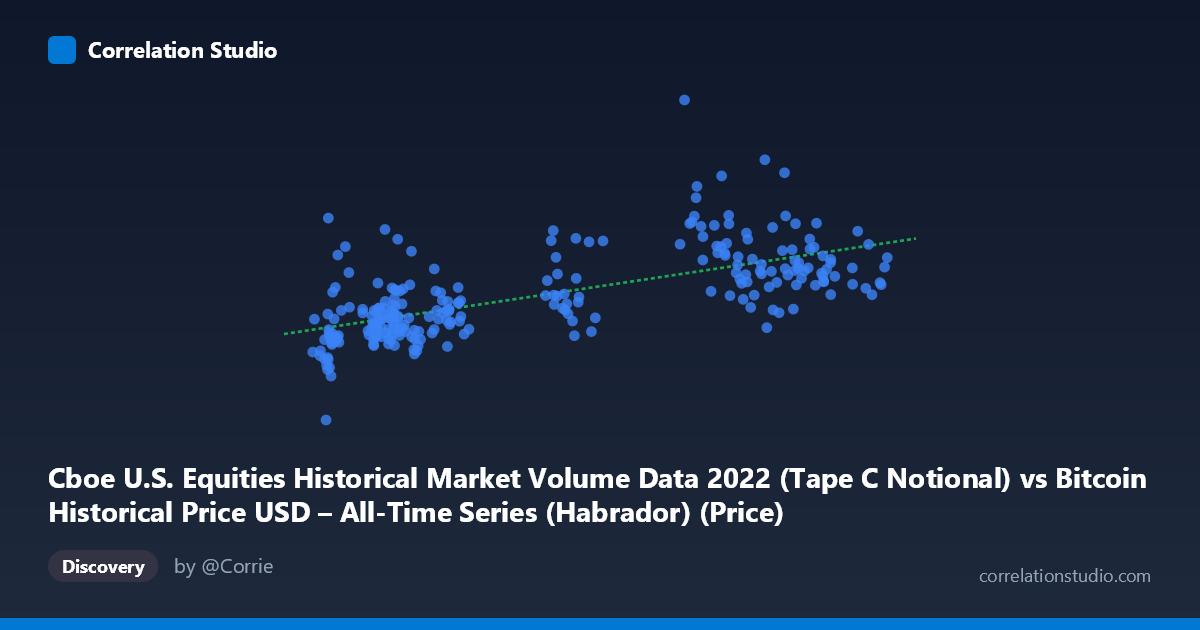
Cboe U.S. Equities Historical Market Volume Data 2022 (Tape C Notional) vs Bitcoin Historical Price USD – All-Time Series (Habrador) (Price)
- Pearson correlation (r)
- 0.6573
- Spearman correlation
- 0.6863
- p-value
- 0
- Sample size (n)
- 251
- 95% confidence interval
- 0.5808 to 0.7224
- Granger causality
- None
- Granger optimal lag
- 10
AI analysis
Analysis: Cboe Equities Volume vs. Bitcoin Price (2022)
1. Relationship Overview
The scatterplot depicts a moderate positive association between U.S. equities market volume (Tape C notional, X-axis) and Bitcoin price (Y-axis) across 251 paired daily observations in 2022. As equity trading volume increases, Bitcoin price tends to rise as well, though the relationship is far from a tight linear pattern — there is considerable vertical scatter at almost every X value, especially in the lower-to-middle range of X (roughly 16,000–25,000).
2. Strength, Direction, and Statistical Confidence
The correlation coefficient (r = 0.657) indicates a moderate-to-strong positive linear relationship, with r² = 0.432 meaning only about 43% of the variance in Bitcoin price is statistically explained by equity volume — leaving more than half unexplained by this single variable. The 95% confidence interval [0.581, 0.722] is reasonably tight and excludes zero, and the p-value (effectively 0) confirms this correlation is highly unlikely to be due to chance in this sample. However, statistical significance should not be conflated with practical predictive power or causation: the Granger causality tests show no significant predictive direction in either direction (X→Y: p=0.589; Y→X: p=0.349), even at an optimal lag of 10 periods. This is a critical caveat — despite the contemporaneous correlation, equities volume does not help forecast future Bitcoin prices, nor vice versa, in a time-series sense.
3. Patterns, Clusters, and Outliers
The data reveals at least two distinguishable behaviors: - A dense lower cluster (X ≈ 16,000–25,000, Y ≈ 9–13 billion) representing the bulk of observations, showing a fairly flat, compressed relationship. - A dispersed upper-right cluster (X ≈ 30,000–47,000) where Y values range widely from ~10 billion to over 22 billion, indicating heteroskedasticity — variance in Y increases substantially as X grows. - Notable outliers include points like (40,716.68, 22,094,292,967.94) and (41,801.16, 21,185,790,097.08), which sit well above the regression line, alongside points like (21,231.66, 15,699,307,894.65) and (20,471.48, 16,540,025,270.31) that spike upward within the lower X cluster — possibly corresponding to specific volatile trading days (e.g., FOMC announcements, crypto-specific shocks like the FTX collapse in November 2022).
4. Confounding Factors and Caveats
This correlation is very likely spurious or indirectly mediated rather than causal. Both series are influenced by common macro factors in 2022 — Federal Reserve rate hikes, inflation data releases, and broad risk-off/risk-on sentiment shifts — which could simultaneously drive equity trading volume up (due to volatility-driven trading) and move Bitcoin price independently for its own reasons (e.g., crypto-specific deleveraging events). Additionally, both series may share non-stationarity or trending behavior over the year, which can inflate correlation coefficients without reflecting a genuine mechanistic link. The lack of Granger causality strongly supports treating this as a coincidental co-movement rather than a predictive relationship.
5. Suggested Next Steps
- Control for macro confounders: Introduce a third variable (e.g., VIX, Fed funds rate, or a crypto volatility index) to test if the X-Y correlation disappears after conditioning on shared market stress indicators. - Test stationarity and de-trend: Apply differencing or log-returns instead of levels to both series before re-running correlation and Granger tests — this often resolves spurious correlation from shared trends. - Examine cluster-specific dynamics: Segment the analysis by month or volatility regime (e.g., pre/post FTX collapse in November 2022) to see if the relationship holds only during specific stress periods. - Avoid using this correlation for trading/forecasting models: Given the null Granger causality, this relationship should not be used as a lead-lag signal for algorithmic trading strategies between equities volume and BTC price.
X dataset: Bitcoin Historical Price USD – All-Time Series (Habrador)
Y dataset: Cboe U.S. Equities Historical Market Volume Data 2022
Part of experiment: Bitcoin - Bitcoin Historical Price USD – All-Time Series (Habrador) vs Cboe U.S. Equities Historical Market Volume Data 2022