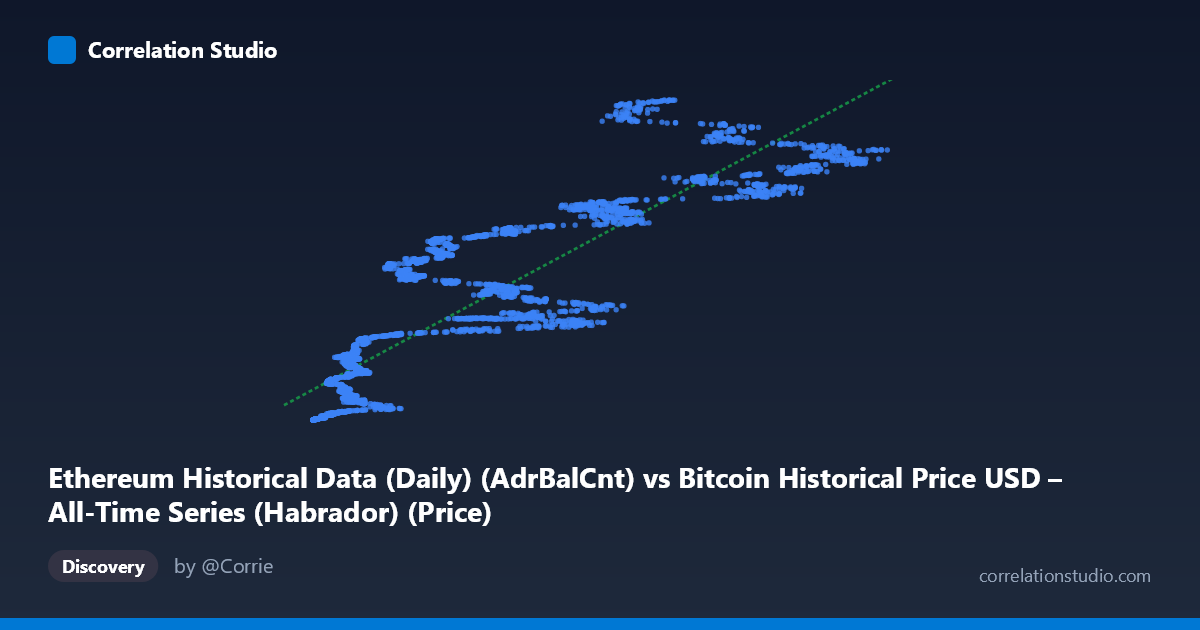
Ethereum Historical Data (Daily) (AdrBalCnt) vs Bitcoin Historical Price USD – All-Time Series (Habrador) (Price)
- Pearson correlation (r)
- 0.8848
- Spearman correlation
- 0.9398
- p-value
- 0
- Sample size (n)
- 3926
- 95% confidence interval
- 0.8778 to 0.8914
- Granger causality
- None
- Granger optimal lag
- 10
AI analysis
Analysis: Ethereum Address Balance Count vs. Bitcoin Price
1. Overall Relationship The scatterplot shows a strong positive relationship between Ethereum's Adjusted Balance Count (X) and Bitcoin's historical price (Y), despite the mismatched axis labels in the metadata. The data reveals a clear upward trend, but critically, it is not linear — the relationship exhibits a curved, decelerating pattern typical of a logarithmic or power-law association. At low X values (under ~10,000), Y rises very steeply, while at higher X values (above ~50,000), the Y values plateau or grow more slowly relative to X increases. This is confirmed by the data: X values near 400-1,200 correspond to Y values in the tens/hundreds of thousands, but X values near 8,000-20,000 already push Y into the tens of millions — a disproportionate jump that flattens out at higher X.
2. Strength, Direction, and Statistical Confidence The Pearson correlation (r = 0.8848) indicates a strong positive linear association, with r² = 0.7828 meaning the linear model explains 78.3% of the variance in Y — a substantial but not complete explanatory power, leaving ~22% of variance driven by other factors or nonlinear dynamics. The tight 95% CI [0.8778, 0.8914] and p-value of 0 confirm this correlation is highly statistically robust and not due to chance, given the large sample (n=3,926). However, the Granger causality tests reveal no significant predictive direction in either direction (X→Y: p=0.745; Y→X: p=0.575) at the optimal 10-period lag. This is a crucial caveat: strong contemporaneous correlation does not imply that one variable temporally forecasts the other — they likely move together due to shared underlying drivers (e.g., overall crypto market cycles) rather than one causing/leading the other.
3. Notable Patterns and Outliers The most striking feature is the curvature — the relationship resembles a saturating/logarithmic curve rather than a straight line, meaning the linear regression (y = 1466.88x + 1.76×10⁷) likely underfits low-X points and overfits mid-range points. There's also evidence of vertical clustering: multiple X values in the 3,000-8,000 range map to a wide spread of Y values (from ~2 million to ~35 million), suggesting time-varying regime shifts — likely corresponding to different market cycles (bull vs. bear years) where the same "network activity level" corresponded to very different price levels. Additionally, a cluster of very high-X, high-Y points (X 60,000, Y 120 million) suggests a distinct high-activity regime, possibly representing a later, more mature market phase.
4. Confounding Factors and Caveats Both variables are almost certainly non-stationary time series with strong trends over the 2015–2026 window, which artificially inflates correlation via spurious trend co-movement — both crypto adoption metrics and prices have grown over a decade, independent of direct causal linkage. The Granger non-causality result supports this concern: the correlation is likely driven by common macro factors (overall crypto market sentiment, adoption cycles, liquidity conditions) rather than a direct mechanical link between Ethereum address counts and Bitcoin price. Additionally, mixing on-chain activity metrics with price data across bull/bear cycles risks conflating multiple distinct regimes into a single misleading trend line.
5. Suggested Further Investigation Given the visible curvature, a log-log transformation (or log-X linear model) should be tested, as it likely fits substantially better than r²=0.78 and would better reflect the true functional form. Since both series are trending and non-stationary, analysts should test for cointegration and consider first-differencing (returns/changes) before drawing causal inferences — this would clarify whether short-term co-movements exist beyond the shared long-term trend. Segmenting data by market cycle (bull vs. bear years) could also reveal whether the relationship's strength or shape shifts regime-to-regime, and cross-referencing with actual Ethereum price (rather than only address count) would help distinguish genuine ETH-BTC price correlation from a network-activity-to-price artifact.
X dataset: Bitcoin Historical Price USD – All-Time Series (Habrador)
Y dataset: Ethereum Historical Data (Daily)
Part of experiment: Bitcoin - Bitcoin Historical Price USD – All-Time Series (Habrador) vs Ethereum Historical Data (Daily)