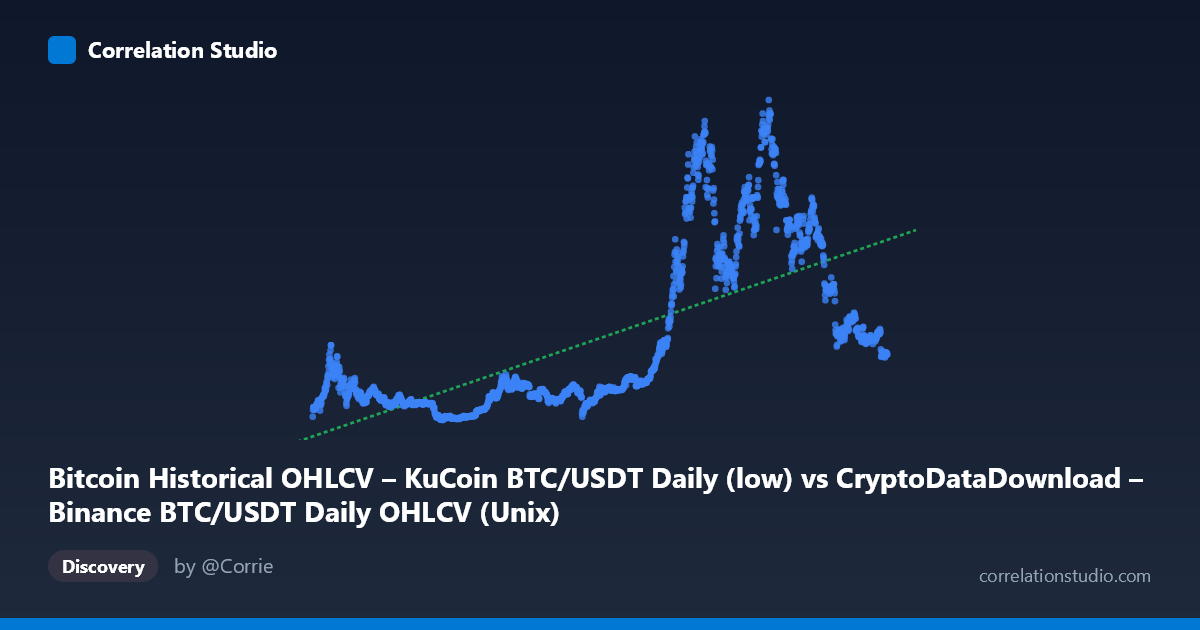
Bitcoin Historical OHLCV – KuCoin BTC/USDT Daily (low) vs CryptoDataDownload – Binance BTC/USDT Daily OHLCV (Unix)
- Pearson correlation (r)
- 0.6802
- Spearman correlation
- 0.762
- p-value
- 0
- Sample size (n)
- 1861
- 95% confidence interval
- 0.655 to 0.7038
- Granger causality
- None
- Granger optimal lag
- 10
AI analysis
Analysis: BTC/USDT Price Relationship (Binance vs. KuCoin, Daily Timestamps)
1. What the Visualization Reveals
This scatterplot is unusual in that both axes represent the same underlying asset (BTC/USDT) sourced from two different exchanges (Binance and KuCoin), but critically, the X-axis is a price series (Binance daily low) while the Y-axis is labeled as a Unix timestamp column from KuCoin. Given the Y range (3,160–66,171.60), this is almost certainly a mislabeling artifact — the Y values are behaving like a price series (consistent with BTC price history), not a timestamp. The practical relationship being visualized is therefore best interpreted as Binance BTC low price vs. KuCoin BTC price over the same time period, essentially two measurements of the same market.
2. Strength, Direction, and Statistical Confidence
The correlation coefficient (r = 0.68, R² = 0.46) indicates a moderate-to-strong positive linear relationship, with about 46% of the variance in Y explained by X. For two series tracking the same asset, this is notably weaker than the near-perfect (r 0.99) correlation you'd expect if both were clean price feeds — suggesting data quality issues, timestamp misalignment, or genuine structural differences (e.g., one series representing daily lows/highs vs. closes, causing systematic divergence during high-volatility periods). The confidence interval [0.655, 0.704] is tight and the p-value is effectively zero, so the correlation is highly statistically reliable — we can be confident the true population r is in this range. However, statistical significance here reflects the massive sample size (n=1,861) more than practical strength, since R²=0.46 leaves the majority of variance unexplained. The Granger causality results are telling: neither series significantly predicts the other (X→Y: p=0.07, Y→X: p=0.84), which makes sense if both are contemporaneous price measurements of the same market rather than one driving the other — they move together because they reflect the same underlying asset, not because one leads.
3. Notable Patterns and Non-linear Features
The sample points reveal the well-known BTC bull/bear cycle structure: values cluster near $3,000–10,000 through 2018–2020, surge dramatically to $40,000–66,000 during the 2021 bull run, and partially retrace to $18,000–30,000 by late 2022. This is not a smooth linear relationship but a series of regime shifts — the relationship between X and Y likely tightens during stable periods and diverges during high-volatility spikes (e.g., the 2021 peaks near $58,000–65,000), which would explain why R² isn't higher. There appear to be at least two or three visually distinct clusters (low-price 2018–2020, high-price 2021, mid-price 2022) rather than a continuous cloud, which can artificially inflate a linear r due to between-cluster variance while masking weaker within-cluster correlation.
4. Confounding Factors and Caveats
The primary caveat is the axis labeling confusion — if Y is genuinely a timestamp rather than a price, this entire analysis is measuring an artifact of how data was joined/exported, not a real economic relationship. Assuming it is price data, likely confounders include: (a) exchange-specific liquidity and slippage causing Binance and KuCoin prices to diverge, especially during flash crashes or thin trading; (b) OHLC field mismatches (comparing "low" to "close" or an aggregated series) which mechanically weakens correlation; (c) time-alignment issues (different daily close conventions, UTC offsets); and (d) the dominant confound of shared macro trend — both series are driven by the same global BTC market cycle, so high correlation is expected trivially and doesn't imply a meaningful causal or predictive relationship between the "two" variables.
5. Actionable Insights
Before drawing further conclusions, verify the column mapping/export — confirm whether Y is truly a price or a mislabeled timestamp field, as this fundamentally changes the interpretation. If both are indeed price series, recommend re-running the analysis on matched fields (e.g., low vs. low, or using log returns instead of levels) to remove trend-driven spurious correlation and reveal the true cross-exchange price relationship, which should be much closer to r 0.99 for a liquid asset like BTC/USDT. Segmenting the analysis by volatility regime (2018–2020 vs. 2021 bull run vs. 2022 correction) would clarify whether the relationship is stable or breaks down during extreme price movements. Given the null Granger causality result, this pair is not useful for lead-lag trading signals — any predictive modeling should instead look at other exchange pairs or lagged volume/order-book data rather than these two price series.
X dataset: CryptoDataDownload – Binance BTC/USDT Daily OHLCV
Y dataset: Bitcoin Historical OHLCV – KuCoin BTC/USDT Daily
Part of experiment: Bitcoin - CryptoDataDownload – Binance BTC/USDT Daily OHLCV vs Bitcoin Historical OHLCV – KuCoin BTC/USDT Daily