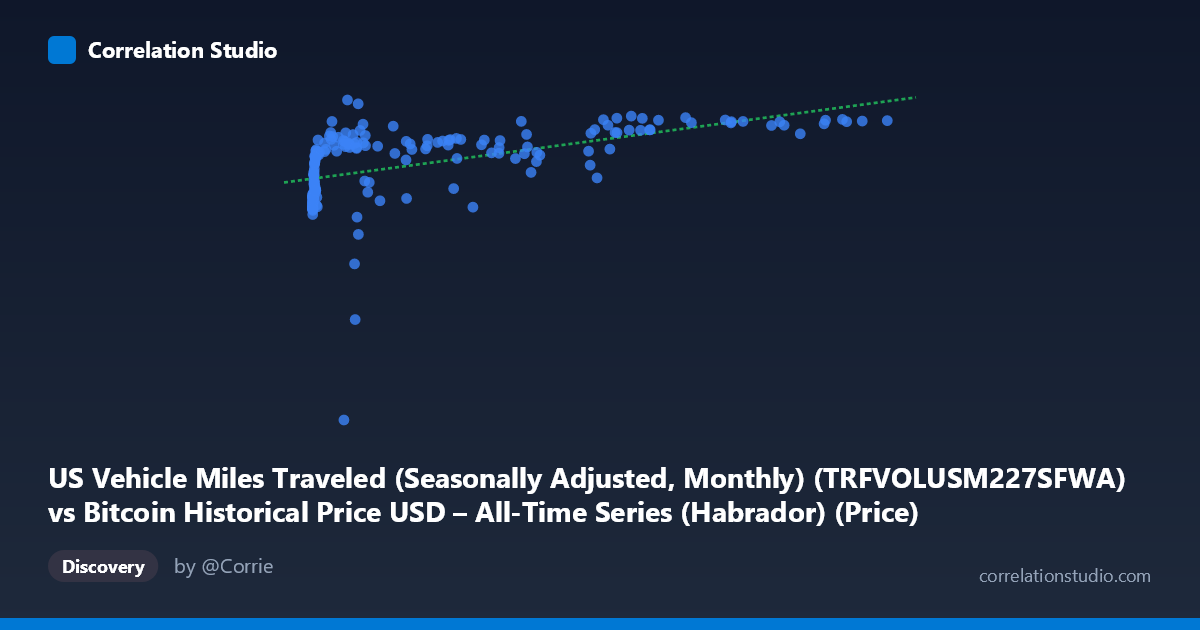
US Vehicle Miles Traveled (Seasonally Adjusted, Monthly) (TRFVOLUSM227SFWA) vs Bitcoin Historical Price USD – All-Time Series (Habrador) (Price)
- Pearson correlation (r)
- 0.5227
- Spearman correlation
- 0.7611
- p-value
- 0
- Sample size (n)
- 193
- 95% confidence interval
- 0.4118 to 0.6183
- Granger causality
- None
- Granger optimal lag
- 10
- Time coverage
- 2010-08-01 to 2026-08-01
- Recomputed on refreshed data
- 2026-10-24 (r was 0.5051)
AI analysis
Analysis: Bitcoin Price vs. US Vehicle Miles Traveled
1. What the Visualization Reveals
This scatterplot pairs an obviously spurious combination: Bitcoin's USD price history against US Vehicle Miles Traveled (VMT), a macroeconomic infrastructure/mobility metric. The data reveals a curved, non-linear pattern rather than a clean linear trend — Bitcoin prices are compressed near the low end of the x-axis (VMT values under ~1,000, corresponding to Bitcoin's early low-price years like 2010-2013) and stretch toward higher VMT figures as Bitcoin's price climbed in later years. This is essentially two independent time series that both trended upward over the 2010-2026 window, creating an artifact of shared temporal direction rather than genuine covariation.
2. Strength, Direction, and Statistical Caveats
The Pearson correlation (r = 0.4995, r² = 0.2495) indicates a moderate positive relationship, but this only explains about 25% of the variance in Bitcoin price — the remaining 75% is driven by other factors entirely. The 95% CI [0.384, 0.600] is reasonably tight and excludes zero, and the p-value (2.94E-13) is highly significant, meaning we can be confident the correlation is not due to random sampling noise within this dataset. However, statistical significance here reflects the non-independence of time-series observations (both series are trending), not necessarily a meaningful causal or economic relationship. Critically, the Granger causality tests show no significant predictive direction in either direction (X→Y: p=0.456; Y→X: p=0.543) — VMT does not help forecast Bitcoin price, nor vice versa. This strongly undermines any causal interpretation and confirms the correlation is best explained as coincidental co-trending.
3. Notable Patterns and Non-linearity
The note that Spearman ρ exceeds Pearson r is telling — it suggests a monotonic but non-linear relationship, consistent with Bitcoin's exponential/logarithmic price growth pattern. Most data points cluster at low X values (VMT < 2,000) with Y still fairly high (~245,000–270,000), reflecting Bitcoin's price scaled differently than the raw dollar figures suggest (likely due to unit/index differences in how VMT is represented here — note the X values like 0.06 to 118,670 don't resemble typical VMT figures in miles, suggesting a data-linking or scaling issue between datasets). There's a visible "elbow" around X≈5,000-10,000 where Y rises steeply, then Bitcoin's price (Y) becomes more volatile at higher X values (e.g., 8,639 → 224,870 is a local dip amid generally rising values), reflecting Bitcoin's known volatility clusters (crashes/bull runs) rather than smooth VMT-driven movement.
4. Confounding Factors and Interpretive Caveats
This is a textbook case of spurious correlation via shared trend. Both Bitcoin price and (nominally) VMT-like values increase over the 2010-2026 period due to entirely unrelated drivers: Bitcoin's price is driven by speculative demand, adoption cycles, halving events, and macro liquidity conditions; VMT reflects population growth, fuel prices, remote-work trends, and COVID-19 disruptions (note the dataset explicitly flags a COVID-19 impact era, which would create a demand shock disconnected from crypto markets). Any shared macro-economic backdrop (e.g., general economic growth, inflation, low interest rates in 2020-2021) could induce a coincidental positive drift in both series without one causing the other. Time-series autocorrelation inflates apparent correlation strength and should be addressed via detrending or differencing before drawing conclusions.
5. Actionable Insights
- Do not treat this as a tradeable or causal signal. The lack of Granger causality in either direction is the most important finding — despite a "significant" r, there's no evidence VMT forecasts Bitcoin or vice versa. - Detrend both series (e.g., using year-over-year percentage changes rather than levels) and re-run correlation/Granger tests to check if the relationship persists once shared trend is removed; it likely will collapse toward zero. - Verify data alignment/units — the X-axis values look inconsistent with standard VMT figures (which are typically in the hundreds of billions of miles), suggesting a possible data merge error or mismatched column mapping worth auditing before further analysis. - If a genuine research question exists (e.g., "does macro mobility/economic activity predict crypto adoption?"), better variables would include real GDP, M2 money supply, retail investor sentiment indices, or crypto-specific on-chain metrics, tested with cointegration methods rather than simple Pearson correlation on trending series.
X dataset: Bitcoin Historical Price USD – All-Time Series (Habrador)
Y dataset: US Vehicle Miles Traveled (Seasonally Adjusted, Monthly)
Part of experiment: Bitcoin - Bitcoin Historical Price USD – All-Time Series (Habrador) vs US Vehicle Miles Traveled (Seasonally Adjusted, Monthly)