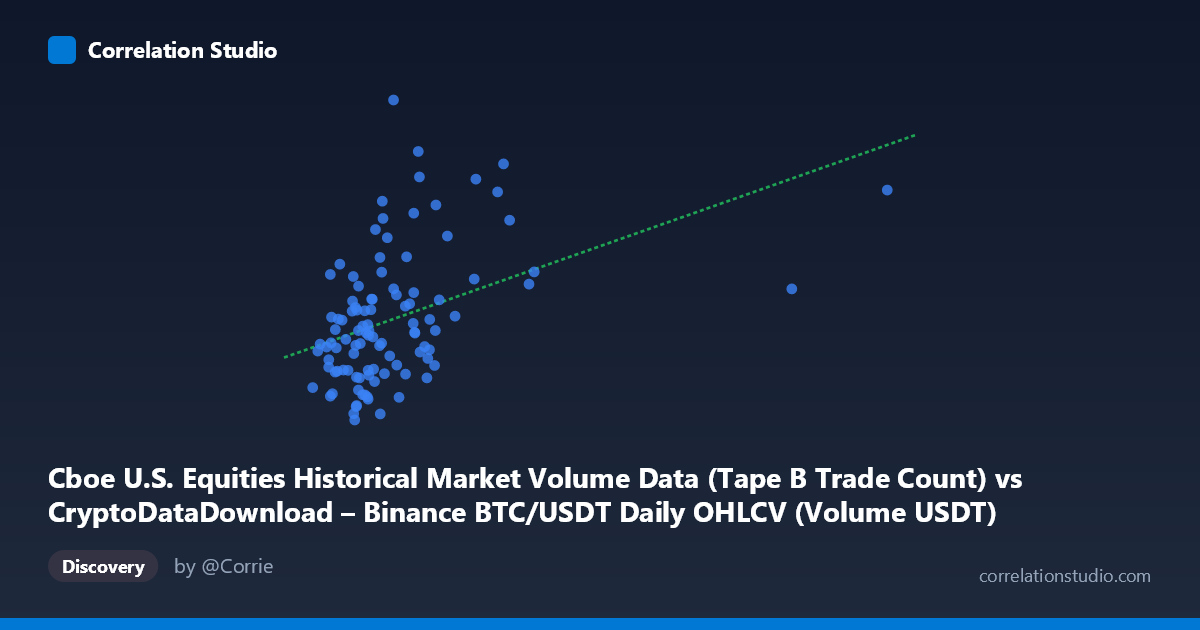
Cboe U.S. Equities Historical Market Volume Data (Tape B Trade Count) vs CryptoDataDownload – Binance BTC/USDT Daily OHLCV (Volume USDT)
- Pearson correlation (r)
- 0.4228
- Spearman correlation
- 0.4415
- p-value
- 0.000008
- Sample size (n)
- 104
- 95% confidence interval
- 0.2506 to 0.569
- Granger causality
- None
- Granger optimal lag
- 10
AI analysis
Analysis: Cboe Tape B Trade Count vs. Binance BTC/USDT Volume (USDT)
1. What the Visualization Reveals
The scatterplot shows a modestly positive, right-skewed relationship between two datasets that are conceptually unrelated at face value: U.S. equities trade counts (Tape B) and Binance BTC/USDT trading volume. The data is heavily clustered in the lower-left region (X roughly 800M–2.5B, Y roughly 650K–1.4M), with a sparse tail of high-X outliers (values up to 7.2B) that appear to pull the regression line but don't necessarily reflect a consistent linear trend. Most of the "signal" driving the correlation likely comes from this small number of extreme X values rather than a uniform relationship across the full range.
2. Strength, Direction, and Statistical Meaning
The correlation coefficient (r = 0.4448) indicates a weak-to-moderate positive relationship, and r² = 0.1978 tells us that only about 20% of the variance in Y is explained by X — meaning roughly 80% of Y's variability is driven by other factors entirely. The 95% CI [0.262, 0.597] is fairly wide, reflecting real uncertainty in the true strength of this relationship, though it does not cross zero, and the p-value (1.122E-05) confirms the correlation is statistically significant and unlikely due to chance in this sample. However, statistical significance here should not be conflated with practical importance — an r² of 0.20 is a weak explanatory relationship. Critically, the Granger causality tests show no significant predictive direction in either direction (X→Y: p=0.79; Y→X: p=0.72), meaning neither series helps forecast the other over time. This strongly suggests the correlation is likely coincidental or driven by a shared external factor (e.g., both series trending with overall market growth/time) rather than a genuine causal or lead-lag relationship.
3. Notable Patterns and Outliers
The data shows a dense cluster of points at lower X values (under ~2.5B) with Y ranging broadly from ~650K to ~1.8M, showing no clear tight linear pattern within this cluster. A handful of high-leverage outliers (X 2.8B, especially the extreme point at X≈7.2B) sit in the upper-middle Y range and have outsized influence on the regression slope and r value — removing them would likely substantially weaken or eliminate the correlation. There's no evidence of a clean linear or non-linear functional form; instead, the pattern looks more like heteroscedastic noise with a few high-value events.
4. Confounding Factors and Caveats
Since both series are time-based (Jan–May 2026) and likely both reflect general market activity/liquidity growth over the sampling window, this is a classic case of spurious correlation via shared temporal trend — both variables may be increasing over time independent of each other, creating an apparent correlation without any mechanistic link between equities trade counts and crypto volume. Additionally, comparing "Tape B trade count" (a discrete count metric) to "Volume in USDT" (a monetary aggregate) mixes fundamentally different units and scales, and the small sample (n=90) drawn from a larger population (N=1,980) may not adequately represent the full distribution, especially given the extreme skew in X.
5. Suggested Next Steps
Given the lack of Granger causality and the outsized influence of a few outliers, I'd recommend: (1) re-running the correlation after removing/winsorizing the extreme X outliers to check if r meaningfully drops toward zero; (2) detrending both series (e.g., differencing or removing time trend) before correlating, to test whether the relationship survives once shared temporal drift is removed; and (3) treating this correlation as not actionable for trading or forecasting purposes given the null Granger result — any apparent relationship is best explained by coincidental co-trending rather than a real economic linkage between U.S. equity market activity and Binance crypto volume.
X dataset: CryptoDataDownload – Binance BTC/USDT Daily OHLCV
Y dataset: Cboe U.S. Equities Historical Market Volume Data
Part of experiment: Bitcoin - CryptoDataDownload – Binance BTC/USDT Daily OHLCV vs Cboe U.S. Equities Historical Market Volume Data