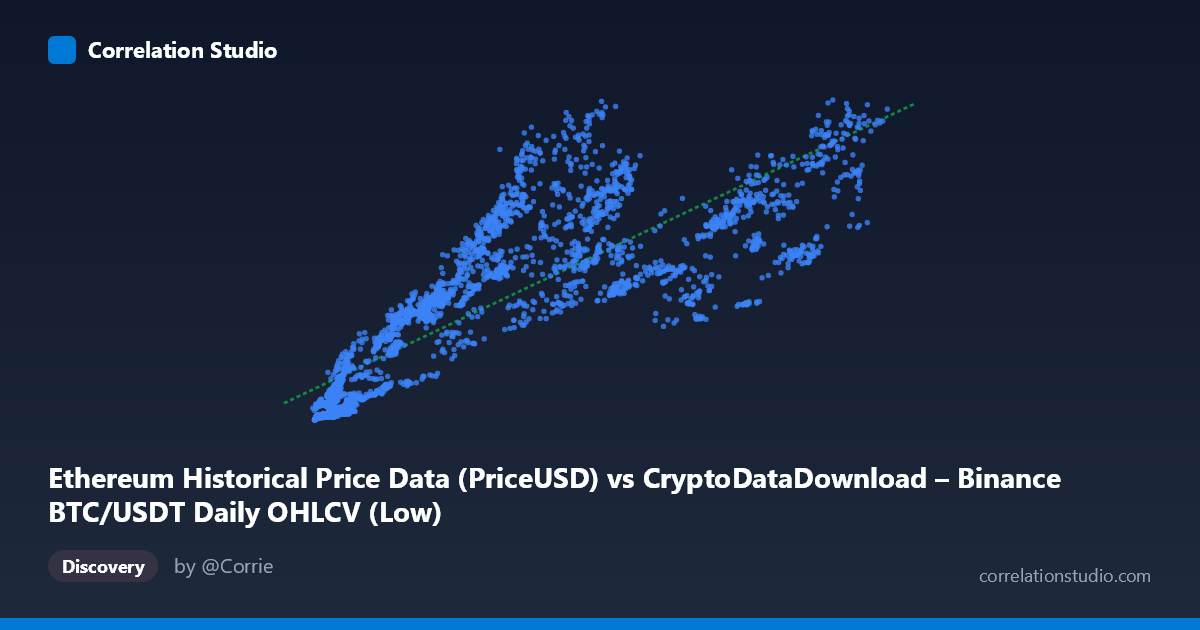
Ethereum Historical Price Data (PriceUSD) vs CryptoDataDownload – Binance BTC/USDT Daily OHLCV (Low)
- Pearson correlation (r)
- 0.8386
- Spearman correlation
- 0.9076
- p-value
- 0
- Sample size (n)
- 3191
- 95% confidence interval
- 0.828 to 0.8486
- Granger causality
- None
- Granger optimal lag
- 5
AI analysis
Analysis: BTC/USDT Price vs. Ethereum Price Relationship
1. What the Visualization Reveals
The scatterplot shows a clear positive association between the two price series (mislabeled axes aside — this is effectively BTC price vs. ETH price over the same time period). As BTC prices rise from the low thousands into six figures, ETH prices climb correspondingly from under $100 to nearly $4,800. The relationship is not a tight, uniform line but rather a broad upward-sloping band, consistent with two assets that share common macro drivers (crypto market sentiment, liquidity cycles, risk appetite) rather than a strict mechanical link.
2. Strength, Direction, and Uncertainty
The correlation coefficient (r = 0.84) indicates a strong positive linear relationship, with R² = 0.703 meaning BTC price explains about 70% of the variance in ETH price — a substantial but incomplete share, leaving roughly 30% driven by ETH-specific factors (network upgrades, DeFi/NFT cycles, gas fees, ETH-specific speculation). The 95% CI [0.828, 0.849] is narrow, and the p-value is effectively zero, so we can be highly confident this correlation is not a statistical fluke given the large sample (n=3,191 daily observations).
Critically, the Granger causality test shows no significant predictive direction in either direction (BTC→ETH: p=0.283; ETH→BTC: p=0.552). This means that despite the strong contemporaneous correlation, neither series' past values help forecast the other's future values beyond what each series' own history provides. Practically: this is a co-movement relationship, not a lead-lag trading signal. The two prices tend to rise and fall together (likely driven by shared external factors like macro liquidity, regulatory news, or overall crypto sentiment), but neither one "causes" or predicts the other in a Granger sense.
3. Notable Patterns and Non-Linear Features
The scatter shows evident heteroscedasticity — variance in ETH price increases substantially at higher BTC price levels (e.g., BTC near $60-110K shows ETH ranging widely from ~$1,800 to ~$4,300), while at low BTC values (~$3,000-10,000) ETH is tightly clustered near $100-450. This fanning-out pattern suggests the relationship isn't perfectly linear — a log-log or power-law relationship might fit better, which is common in asset price data spanning multiple orders of magnitude. There also appear to be regime-like clusters: a low-price cluster (BTC <$10K, ETH <$500, likely 2018-2019), a mid-range cluster, and a high-price cluster (BTC $60K), suggesting the relationship may differ across bull/bear market regimes rather than being stable throughout.
4. Confounding Factors and Caveats
Several caveats apply. First, both series are non-stationary time series (trending prices), which can artificially inflate correlation and even Pearson significance — this is the classic "spurious regression" risk in financial time series, and the Granger test result is a useful corrective, showing the correlation may reflect shared trends rather than genuine interdependence. Second, both assets are driven by common confounders: overall crypto market cap flows, Bitcoin dominance shifts, macro liquidity (Fed policy, dollar strength), and exchange-specific factors (Binance liquidity/volume) — none of which are controlled for here. Third, the time span (2017-2026) covers multiple distinct market regimes (2018 bear market, 2020-21 bull run, 2022 crash, subsequent recovery), and pooling all these together can mask regime-specific dynamics.
5. Suggested Further Investigation
To move beyond this descriptive correlation: (a) test the relationship on returns/log-returns rather than raw prices to address non-stationarity and get a cleaner measure of co-movement; (b) run regime-segmented analysis (bull vs. bear markets) to see if the correlation strength or slope changes; (c) explore a log-log regression given the apparent heteroscedasticity and multi-order-of-magnitude price ranges; (d) investigate the ETH/BTC ratio directly as its own time series to study relative strength trends; and (e) since Granger causality found no lead-lag effect at daily granularity, consider testing at different lag structures or higher-frequency data, or incorporate a third variable (e.g., overall crypto market cap or stablecoin flows) as a potential common driver in a multivariate model.
X dataset: CryptoDataDownload – Binance BTC/USDT Daily OHLCV
Y dataset: Ethereum Historical Price Data
Part of experiment: Bitcoin - CryptoDataDownload – Binance BTC/USDT Daily OHLCV vs Ethereum Historical Price Data